



Download Report Here
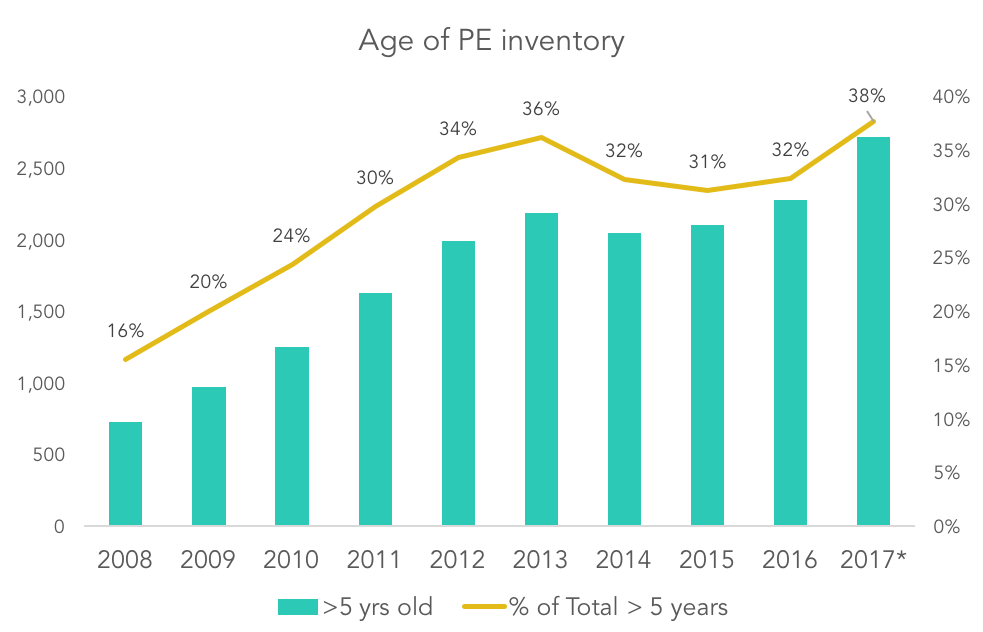
Last week we highlighted the climb in equity contributions in recent years. Relative to debt contributions, equity now makes up 57% of EV year-to-date, a significant percentage that will likely water down future fund returns. A second trend bears mentioning as it relates to returns, highlighted in our upcoming 3Q US PE Breakdown Report: a re-aging inventory. 38% of currently PE-backed platform companies were acquired at least five years ago. PE returns are in a never-ending race against time, and while the textbook buyout cycle allows for straggling investments to be held for 5+ years, the typical 5+ year inventory isn’t usually this high. The last time it approached current levels was back in 2013, right before a massive surge in exits, especially secondary buyouts, over the next three years. Another seller’s market doesn’t appear to be around the corner in 2017—what happens this time?
Stalled as it is, the M&A market likely won’t play the white knight role; the IPO market is another topic entirely. The more likely near-term scenario is another upswing in secondary buyouts, especially with PE firms flush with new funds and limited deal flow. A rise in SBOs wouldn’t change PE’s inventory much, but it would allow aging investments to pass hands and put new capital to work, which is something of solution, albeit less than ideal. Secondary buyouts often short-change LPs invested in the funds, which sometimes effectively sell portfolio companies to themselves if they’re invested in both the buyer and seller, not to mention additional fees and, on average, much lower returns compared to primary/initial buyouts (about 15% lower, according to one Harvard study). SBOs are already well-above historical pace this year, accounting for 43% of US exits versus 29% last year. It’s looking more and more like a perfect storm for SBOs, which won’t thrill investors, but that percentage has to come down somehow.
Contact: Alex Lykken
alex.lykken@pitchbook.com



Latest news
PIK Your Next Adventure
Every amended PIK loan hits the same crossroad. Not everyone ends up at the same destination.
Top 50 BDCs Accounted for 75% of Nonaccrual Loan Cost in Q2’26
The 50 largest BDCs, on the basis of total debt investments as of the second quarter of 2026, accounted for 75% of the total aggregate reported value of nonaccrual debt at cost and fair value.
Private Credit Defaults 101: Beyond the Noise
Like any good school year, this series went by fast. But unlike the end of the year, we’re not out for the summer.