



Download PitchBook’s Report click here.
Much has been said about PE dry powder levels, which continue to peak year after year. Our calculations show about $848 billion of unspent buyout/growth capital across North America and Europe (as of June 30, by the way). That’s still a 22% increase over year-end 2016 numbers, a noteworthy surge in the span of six months. That’s a concern for many—how are investors supposed to deploy so much capital in a competitive, frothy market? Quality targets are hard to come by, and the ones that do come to market cause a ruckus, like a good Shark Tank episode.
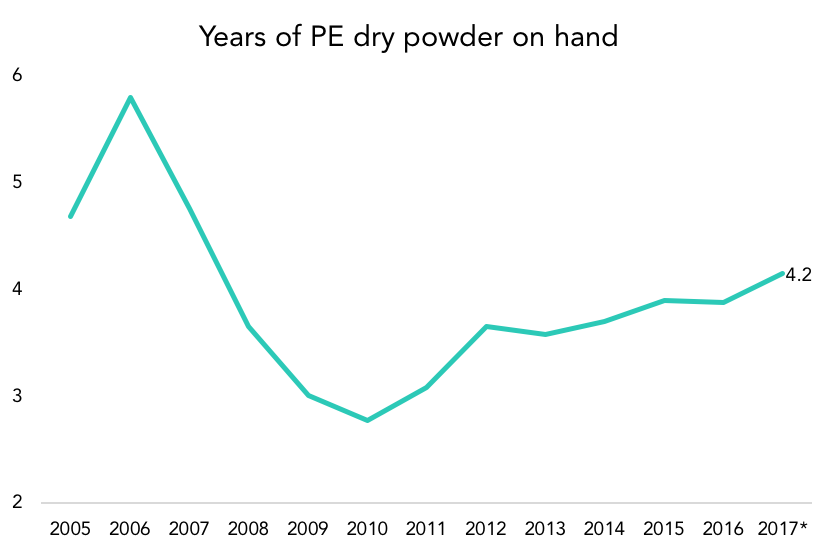
Does dry powder reflect too much competition and too few targets? Yes in part, but competition and deal flow will always have an impact. We wanted to see if fundraising levels are outpacing deal activity to such a degree to justify industry concern. To measure that pace, we used a trailing three-year average of total fund contributions as a proxy for investment activity. What we found suggests that capital deployment has accelerated almost in tandem with increasing dry powder levels. Through mid-2017, PE had about 4.2 years of dry powder on hand. Even bringing early 2017 fundraising into the picture, that isn’t a huge increase over recent years. Investors had about 3.9 years’ worth in 2016, and as far back as 2012 the average was just under 3.7 years. Compare that to pre-crisis levels, which peaked at six years’ worth of dry powder in 2006. PEGs would have boasted about that figure at the time, but it’s concerningly high in hindsight. We should keep today’s slower pace in mind before we get too concerned this time around.
Contact: Alex Lykken
alex.lykken@pitchbook.com




Latest news

US leveraged loans returns turn negative in October
The Bloomberg US Leveraged Loan Index (Ticker: LOAN) has returned -0.26% this month through October 21, reducing its year-to-date return…

M&A activity begins to tick upward
In the third quarter of 2026, acquisition-linked loan volume across North America and Europe reached about $47 billion, up from $30.6 billion in Q2 and $29.5 billion a year ago.
