



PE Firms Pumping out the Cash
U.S. PE firms distributed about $98 billion more back to investors than they called down in 2013. Total distributions amounted to $232.5 billion last year, a ten-year high and 3% increase over total distributions in 2012. While distributions increased in 2013, capital calls were down from 2012 levels, to $134.6 billion from $169.7 billion. Those aren’t surprising numbers, given the frothy exit environment we saw in the back half of 2013 and the slowdown in deal flow around the same time.
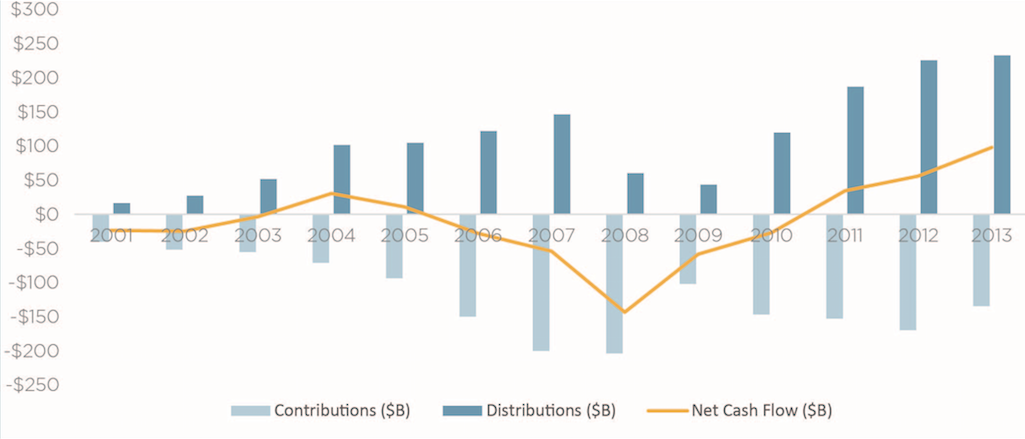
At least in the U.S., PE firms have taken full advantage of high markups in company valuations, and have focused mostly on exits (and fundraising) since 2013 and remained on the sidelines for new investments. As we’ve covered in previous 2014 reports, that approach didn’t change much this year, so it wouldn’t be surprising to see net cash flow continue its incline as early 2014 returns data begins to come in.



Latest news

PIK Your Next Adventure
Every amended PIK loan hits the same crossroad. Not everyone ends up at the same destination.
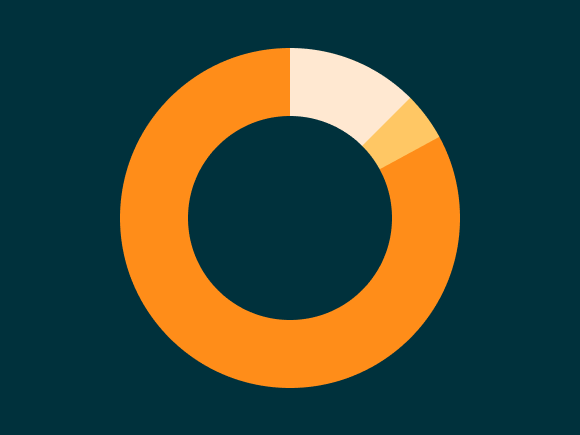
Top 50 BDCs Accounted for 75% of Nonaccrual Loan Cost in Q2’26
The 50 largest BDCs, on the basis of total debt investments as of the second quarter of 2026, accounted for 75% of the total aggregate reported value of nonaccrual debt at cost and fair value.
Private Credit Defaults 101: Beyond the Noise
Like any good school year, this series went by fast. But unlike the end of the year, we’re not out for the summer.