



Download PitchBook’s Global PE Deal Multiples Report Here
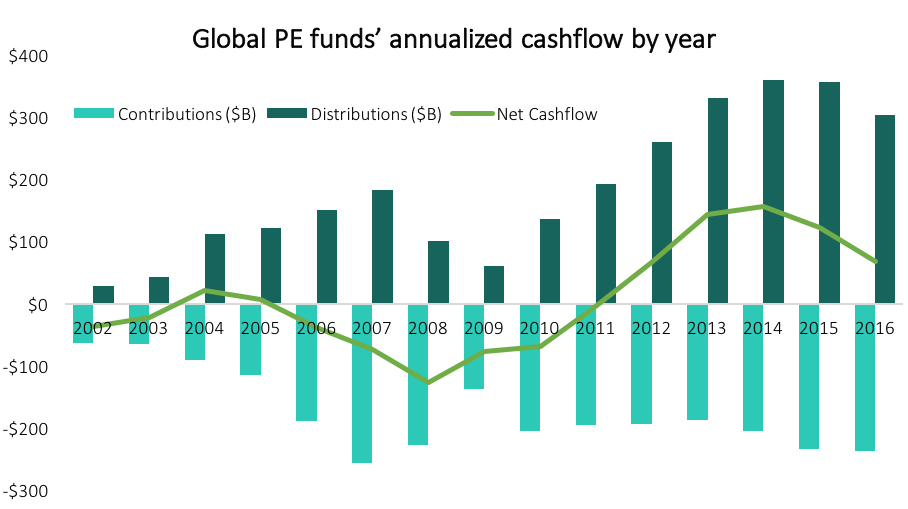
According to our new PE & VC Fund Performance Report, released this week, net cashflows to private equity investors stayed in positive territory through 2016. Net cashflows (the difference between LP contributions and GP distributions) are on a downward trend and, while they may stay positive for another year, are destined to turn negative as the new buyout cycle gains steam. What’s worth noting in the accompanying chart, however, is the sheer size of aggregate GP distributions following the financial crisis. 2014 and 2015 were both strong years for distributions, totaling $360 billion and $356 billion, respectively, on a global basis. LP contributions bottomed out in 2013 at $189 billion before PE deal activity picked up in earnest the following year (US capital invested alone popped 29% YoY in 2014).
Global PE fundraising has largely mirrored the surge in distributions. GPs distributed about $331 billion back to investors in 2013, a 27% jump over 2012 totals. That helped propel an 84% increase in global PE fundraising that year and marked the beginning of a four-year stretch (2013-2016) that saw a combined $1.1 trillion in PE commitments. With 2017 on pace for another near-record year, we’re likely seeing an anomalous five-year boom in PE fundraising that may not be repeated any time soon; record PE distribution levels neatly coincided with yield-starved bond and equity markets and a hedge fund industry that has disesteemed itself recently through poor performance. Whether PE can pull off an encore performance during the next fundraising cycle largely depends on how effectively it manages its new $1 trillion+ coffer. If we’ve learned anything from the hedge fund industry, it’s that allocations from institutional investors aren’t set in stone.
Contact: Alex Lykken
alex.lykken@pitchbook.com


Latest news

Share of PE middle-market deal count by backing type
Add-ons remain the workhorse for middle-market deployment, accounting for 67. 1% of all middle-market transactions YTD, in line with activity seen in recent years.

Software deal share falls in middle markets, rises in large caps
In Q3’26 software’s share of total deals fell in both the Lower Middle Market (to 7%) and Upper Middle Market (to 9%), while Large Cap saw a modest uptick in share to 8%.

Secondary loan prices stabilize following steep declines
Secondary loan prices came under significant pressure through September and October, with the Bloomberg U.S. Leveraged Loan Index declining 119…