



Download PitchBook’s Report here.
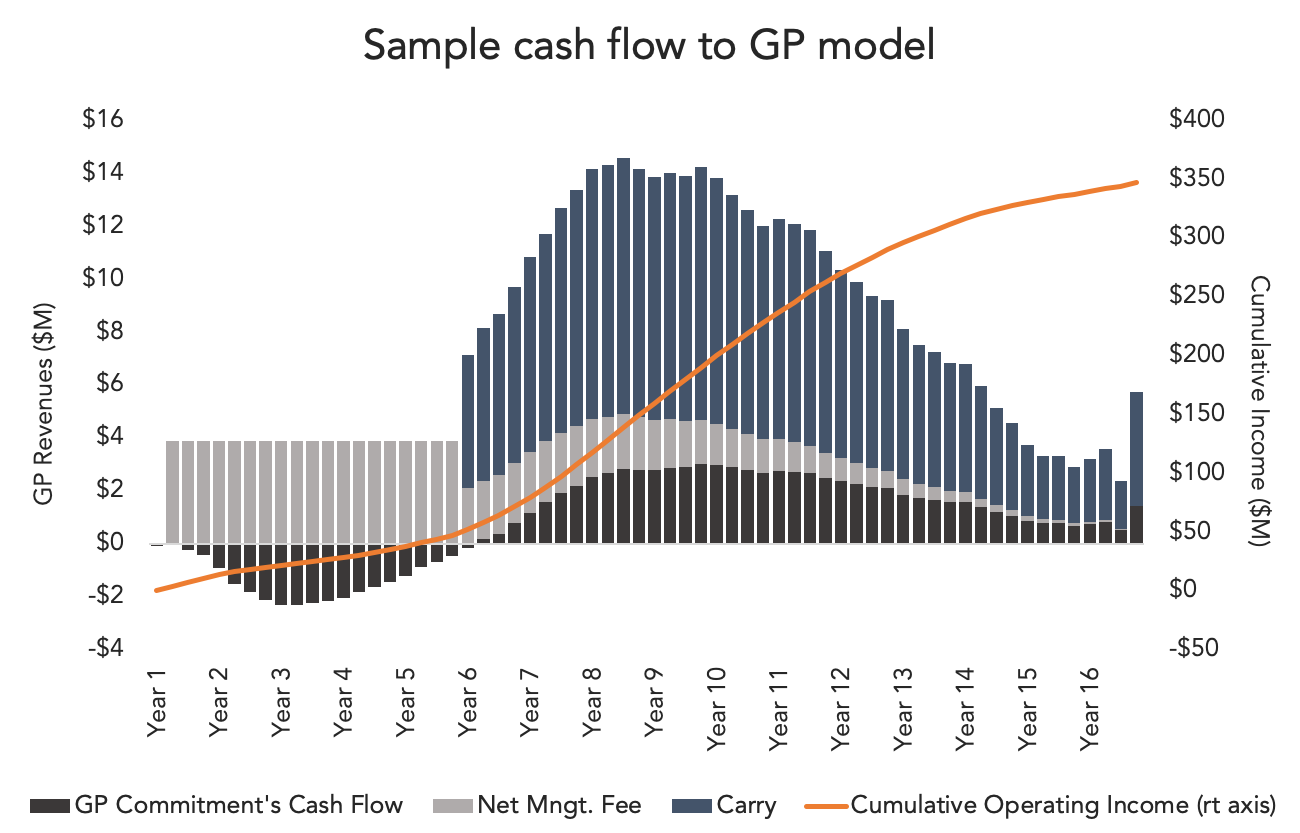
Valuing PE management companies can be extremely difficult, but the rise of GP stakes investing is making the task more common. In recent years, many GPs have been valued predominantly on cash flows, management fees and accrued performance fees. The timing of carry is inexact, which becomes problematic when trying to pin a price tag on a private equity firm. In our latest PE analyst note, we’re introducing a new tool aimed at helping investors better understand the fund-level economics that are factored into a GP’s valuation. The motivation is to help the market examine the implicit assumptions that go into those valuations, and if those valuations are fair or not. They can also be used by LPs to more accurately gauge market expectations when GPs close a new fund.
Using PitchBook fund performance data, we can plot out and visualize the average cash flow profile of a typical PE fund. The chart above has been smoothed out using a rolling four-quarter average to better show those cash flows over time. The sample chart stretches out to 16 years, but PitchBook users can customize their inputs and end up with different charts, with different timeframes and different variables. Our model, for example, can account for different time horizons, return assumptions and discount rates. We can also run sensitivity analyses to understand how tweaks in performance assumptions can alter the balance between management fees and carry. More tools are being developed, but in the meantime, PitchBook clients are welcome to contact their account managers if they’d like to perform some custom analysis, using your own inputs and assumptions.


Latest news

Share of PE middle-market deal count by backing type
Add-ons remain the workhorse for middle-market deployment, accounting for 67. 1% of all middle-market transactions YTD, in line with activity seen in recent years.

Software deal share falls in middle markets, rises in large caps
In Q3’26 software’s share of total deals fell in both the Lower Middle Market (to 7%) and Upper Middle Market (to 9%), while Large Cap saw a modest uptick in share to 8%.

Secondary loan prices stabilize following steep declines
Secondary loan prices came under significant pressure through September and October, with the Bloomberg U.S. Leveraged Loan Index declining 119…