



Download PitchBook’s Report here.
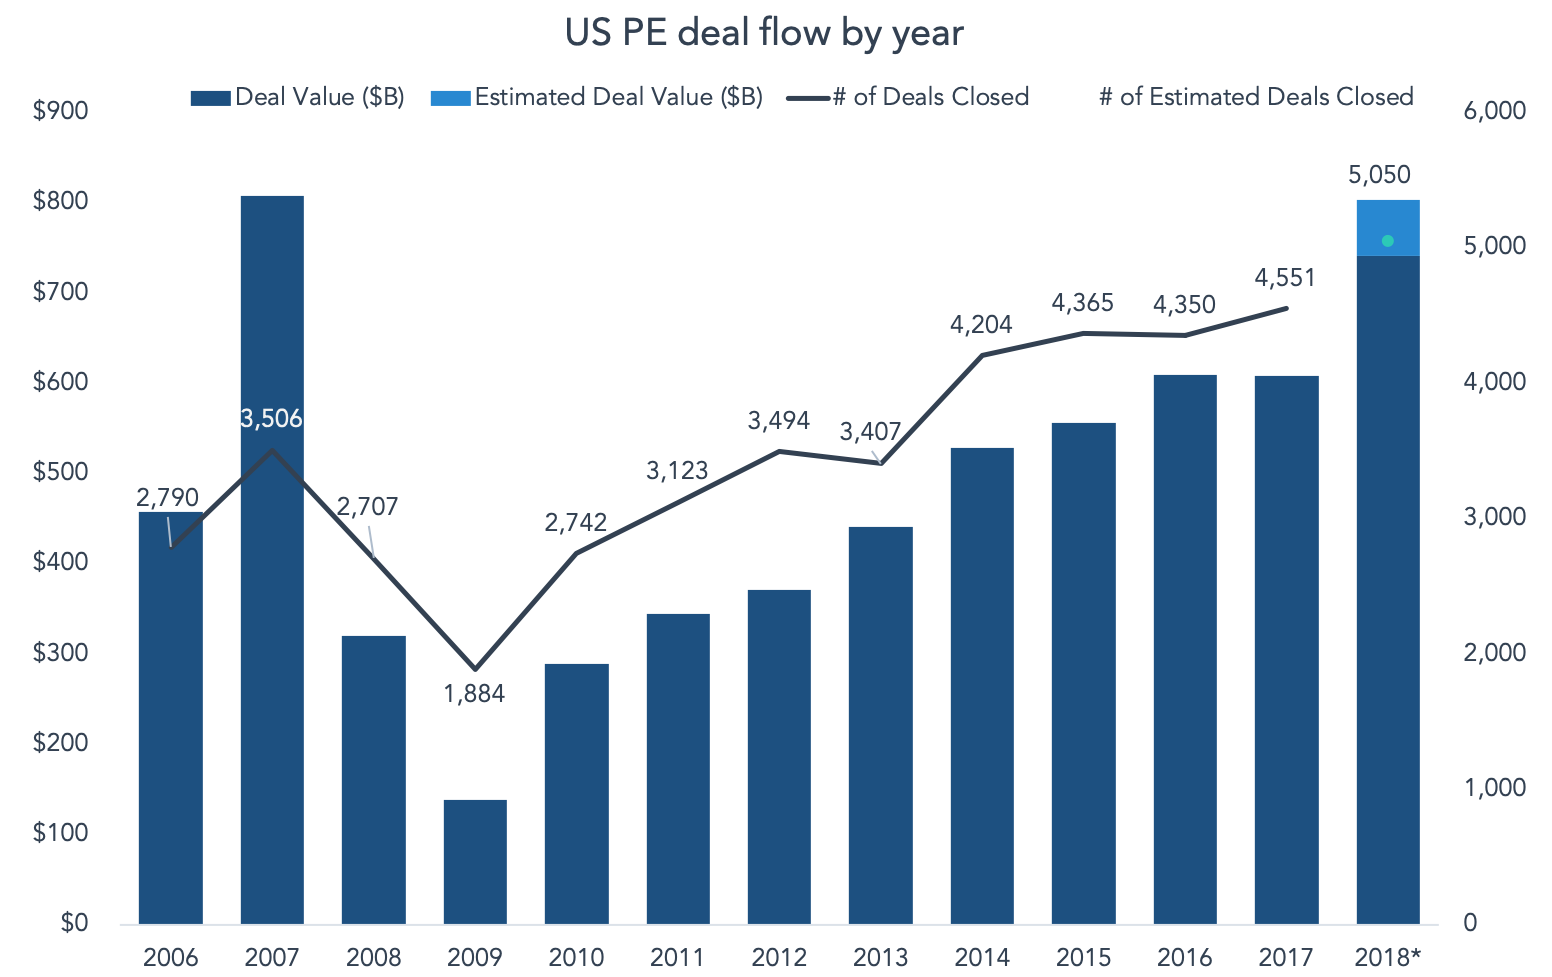
Thanks to a massive Q4 to close out the year, 2018 came close to setting a new record for combined deal value. About $277 billion was invested in Q4, versus a relatively paltry $198 billion invested in Q3 2018. Fourth quarters typically see the highest numbers in any given year, as teams race to close in-progress deals before the calendar turns. But this year’s race to the finish line was pronounced, even compared to past fourth quarters. The only Q4 that holds its own is Q4 2007, which clocked in at $272 billion but through a fraction of 2018’s volume (816 transactions then versus more than 1,300 today). That helped bring last year’s combined value with a stone’s throw of the 2007 record—$803.5 billion last year, just short of 2007’s record $807.2 billion.
As things turned out, Q4 2007 reached heights that wouldn’t be seen for another 11 years. Q1 2008 value dropped to $110 billion, largely due to a diminished pipeline; fear of contagion had picked up steam but the first noteworthy bank failure wouldn’t happen until July. In hindsight, 2007’s mammoth year was propped up by several blockbuster deals, and the numbers were largely dependent on deal sizes that aren’t seen nearly as often today. Moreover, recent deal flow figures are starting to reflect the massive fundraising statistics over the past two years. 2016 and 2017 each saw more than $200 billion raised across the PE landscape, which marked the first time we’ve seen those totals in consecutive years. There’s simply a ton of dry powder laying around, and we’re starting to see it show up on the deal side. Before this past quarter, Q3’s “relatively paltry” $198 billion was, briefly, the highest quarterly total recorded since the crisis. The back half of 2018 inked a combined $474.9 billion, while the back half of 2007 was only a notch or two higher at $486.9 billion.
Contact: Alex Lykken
alex.lykken@pitchbook.com


Latest news

Share of PE middle-market deal count by backing type
Add-ons remain the workhorse for middle-market deployment, accounting for 67. 1% of all middle-market transactions YTD, in line with activity seen in recent years.

Software deal share falls in middle markets, rises in large caps
In Q3’26 software’s share of total deals fell in both the Lower Middle Market (to 7%) and Upper Middle Market (to 9%), while Large Cap saw a modest uptick in share to 8%.

Secondary loan prices stabilize following steep declines
Secondary loan prices came under significant pressure through September and October, with the Bloomberg U.S. Leveraged Loan Index declining 119…