



Download PitchBook’s Report here.
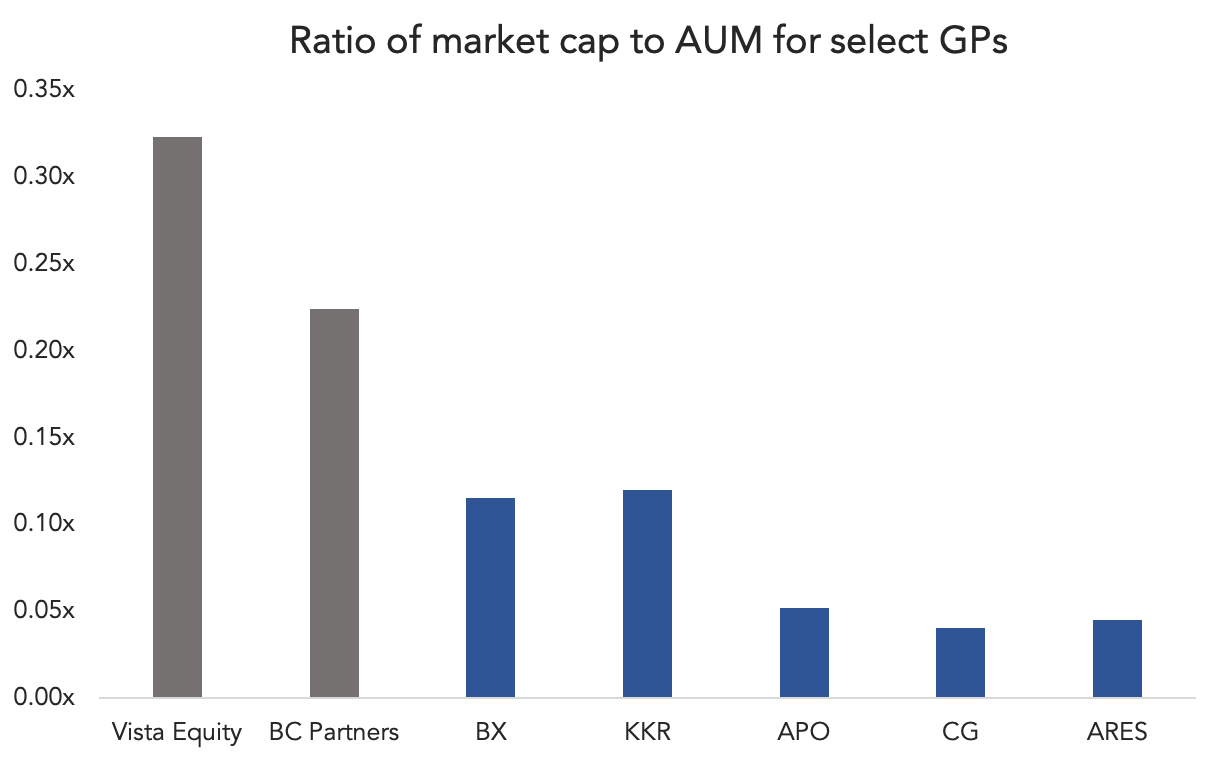
Recent GP stake deals are giving us a growing sample size of private PE firm valuations. We already had a small set for publicly traded PE firms, and we’ve heard ad nauseum that the public markets don’t fully understand how to value firms like Blackstone or Apollo. Much of that misunderstanding revolves around all the different, complex strategies they employ, ranging from real estate to credit and infrastructure to hedge funds. The “big five,” charted above, are closer kin to asset managers than they are to their private equity roots. Their share prices have largely languished over the years despite their growth in AUM.
In a recent analyst note, we ran a quick comparison of private and public PE firm valuations using market caps against AUMs. It’s an oversimplification given the myriad of strategies baked into each firm’s valuation, but it’s interesting to see. A few months ago, for example, BC Partners sold part of itself at a $5.6 billion valuation. Total assets were about $25 billion, making the firm’s private valuation about a fifth of its AUM. Blackstone, by contrast is valued around $60 billion, just a tenth of its approximately $550 billion AUM. Vista is another example on the private side—the firm sold a minority stake to Dyal in 2015 at a $4.3 billion valuation, despite only accumulating $13.3 billion of assets at the time. Vista’s market cap-to-AUM ratio was about a third, compared to more recent ratios for Apollo, Carlyle and Ares, which are all trading well below a tenth of their AUMs.
BC Partners and Vista have branched out a bit from private equity, but not nearly as much as their public peers. They both sport credit strategies now but they haven’t ballooned into real assets or infrastructure or hedge funds like the biggest firms have. They may one day, if they choose to go public, which tempts plenty of firms looking for liquidity or expansion capital. For now, we think most PE firms will continue operating privately until they can trade at a premium to compensate for all of the stresses of going that route.


Latest news

Share of PE middle-market deal count by backing type
Add-ons remain the workhorse for middle-market deployment, accounting for 67. 1% of all middle-market transactions YTD, in line with activity seen in recent years.

Software deal share falls in middle markets, rises in large caps
In Q3’26 software’s share of total deals fell in both the Lower Middle Market (to 7%) and Upper Middle Market (to 9%), while Large Cap saw a modest uptick in share to 8%.

Secondary loan prices stabilize following steep declines
Secondary loan prices came under significant pressure through September and October, with the Bloomberg U.S. Leveraged Loan Index declining 119…