



Download PitchBook’s Report here.
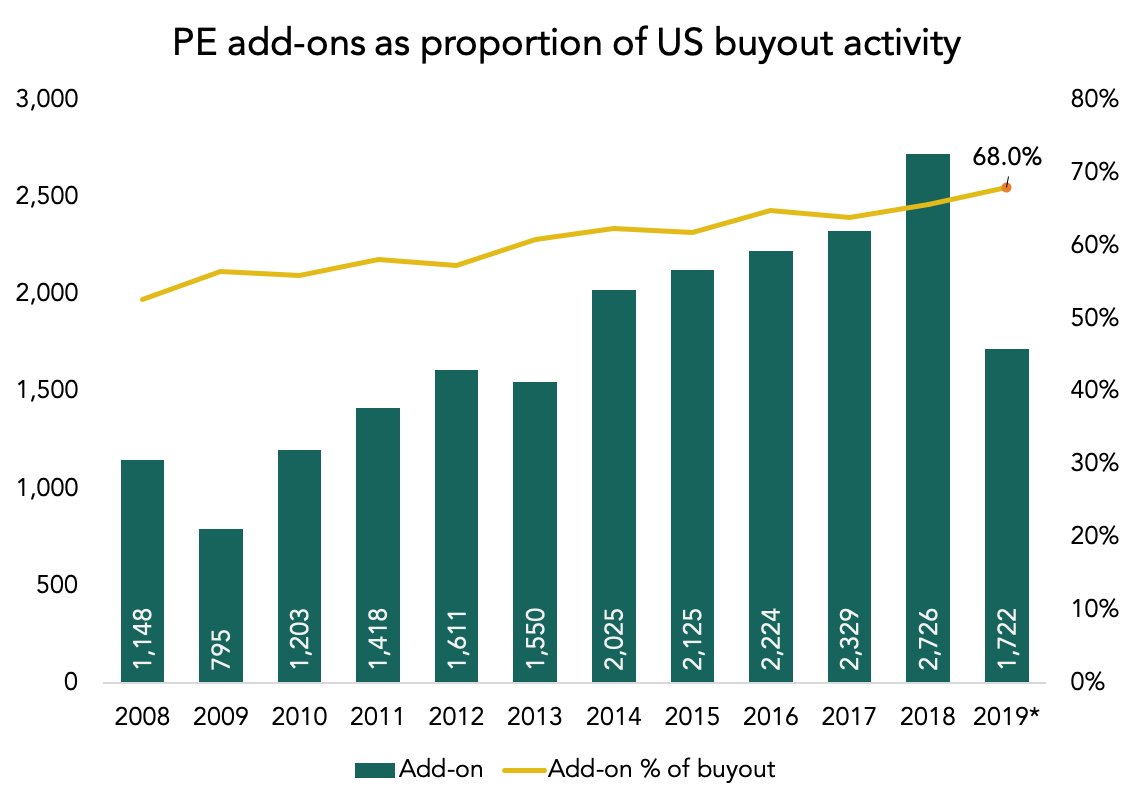
Add-ons now account for 68% of all US PE buyouts. If that pace holds, 2019 will notch another high-mark for the add-on/LBO ratio, which has been trending up for the past decade. That’s according to PitchBook’s 3Q Breakdown Report, just released this week. Two crosswinds have helped boost that ratio to today’s level—a heightened focus on the buy-and-build model and ever-increasing buyout multiples, which reached 12.9x so far this year. Increasing price tags aren’t the sole cause of more add-on activity, but it’s probably not a coincidence either. Add-ons are popular in rich environments because they help blend down the aggregate acquisition multiple over time and spur growth for the original platform.
We covered add-ons in more detail last year (here and here), but it’s worth reiterating the potential impact trends like these will have on the broader PE market over time. For one thing, we found that most add-ons are done by a relatively sparse number of investors; not every platform buyout undergoes the buy-and-build treatment, while other platforms are much more prolific than average. For platforms that do those acquisitions, however, it takes them more time to exit from their private equity sponsors—about a year longer compared to non-acquisitive platforms. Elongated hold times weigh down the platform investment’s ultimate return, so the value-add of each add-on needs to be carefully considered on the part of the sponsor. With that in mind, they also need to act quickly on add-on targets. Another tidbit we found was that the first add-ons done by a given platform were completed within a year of the platform itself being acquired. Given the time it takes for any acquisition to close, we can round that down closer to zero, or at least to the frantic “first hundred days” mark. Taken together, add-on data paints a picture of PE investors navigating an expensive market through acquisitive growth plans—among other efforts—and doing so very early in the process. And considering how long the trend has sustained itself, we can assume investors are getting better and better at buy-and-build over time.


Latest news

Share of PE middle-market deal count by backing type
Add-ons remain the workhorse for middle-market deployment, accounting for 67. 1% of all middle-market transactions YTD, in line with activity seen in recent years.

Software deal share falls in middle markets, rises in large caps
In Q3’26 software’s share of total deals fell in both the Lower Middle Market (to 7%) and Upper Middle Market (to 9%), while Large Cap saw a modest uptick in share to 8%.

Secondary loan prices stabilize following steep declines
Secondary loan prices came under significant pressure through September and October, with the Bloomberg U.S. Leveraged Loan Index declining 119…