



Download PitchBook’s Report here.
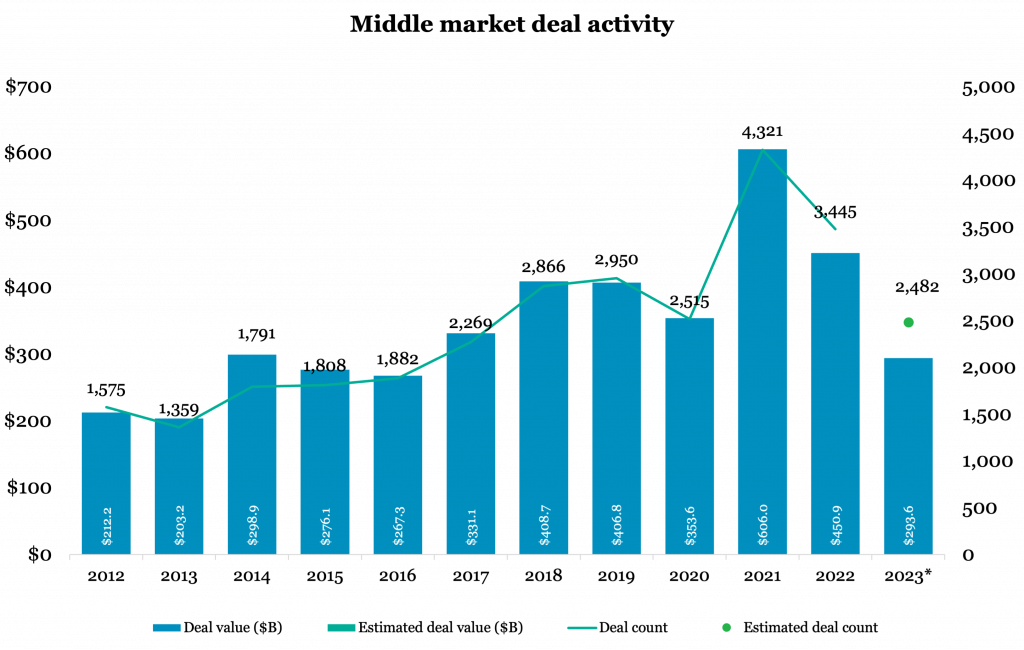
Middle market buyouts are down to a six-year low, according to PitchBook’s Q3 US PE Middle Market Report. The third quarter dipped to an estimated $87.7 billion, a 13% decline from Q2 2023 and a 48% decline from the peak in Q4 2021. That’s coinciding with a visible drop in middle-market valuations. The median EV/EBITDA multiple stands at 11.4x through Q3, down a turn-and-a-half from 2022’s median (13.0x).
2023 will end above the $300 billion mark for seventh straight year, but it will be one of the lower years in that timeframe. Megadeals are also down, which is pushing up the middle market’s share of PE activity to 74%. That’s a high percentage but one where the middle market is hurting, so it feels a bit artificial for now. As the report points out, “the supply of willing buyers and sellers shrank during Q3.” We still see a rebound coming for the middle market but this quarter’s reading wasn’t the beginning of one.
(Past performance is no guarantee of future results.)



Latest news

US Leveraged Loans Return 3.36% to Investors YTD
The Bloomberg US Leveraged Loan Index (Ticker: LOAN) returned 0.96% in August and has gained an additional 0.28% through September…

PE dry powder
The capital that is being raised is flowing overwhelmingly to the largest, most established managers.

Middle market debt held by BDCs vs High yield vs Treasury yields
The blue line represents the current dividend yield of the VanEck BDC Income ETF (BIZD), which stood at 11.7% as…