



Download PitchBook’s Report here.
The past couple weeks we’ve been covering some of the PE predictions we made last year. We’ll be doing a much deeper dive on our upcoming free webinar, co-hosted with ACG. Here’s the registration link, and mark your calendars for December 17th if you’d like to join.Yours truly will be moderating, and I’ll be joined by two senior analysts on our private equity team, Dylan Cox and Wylie Fernyhough.
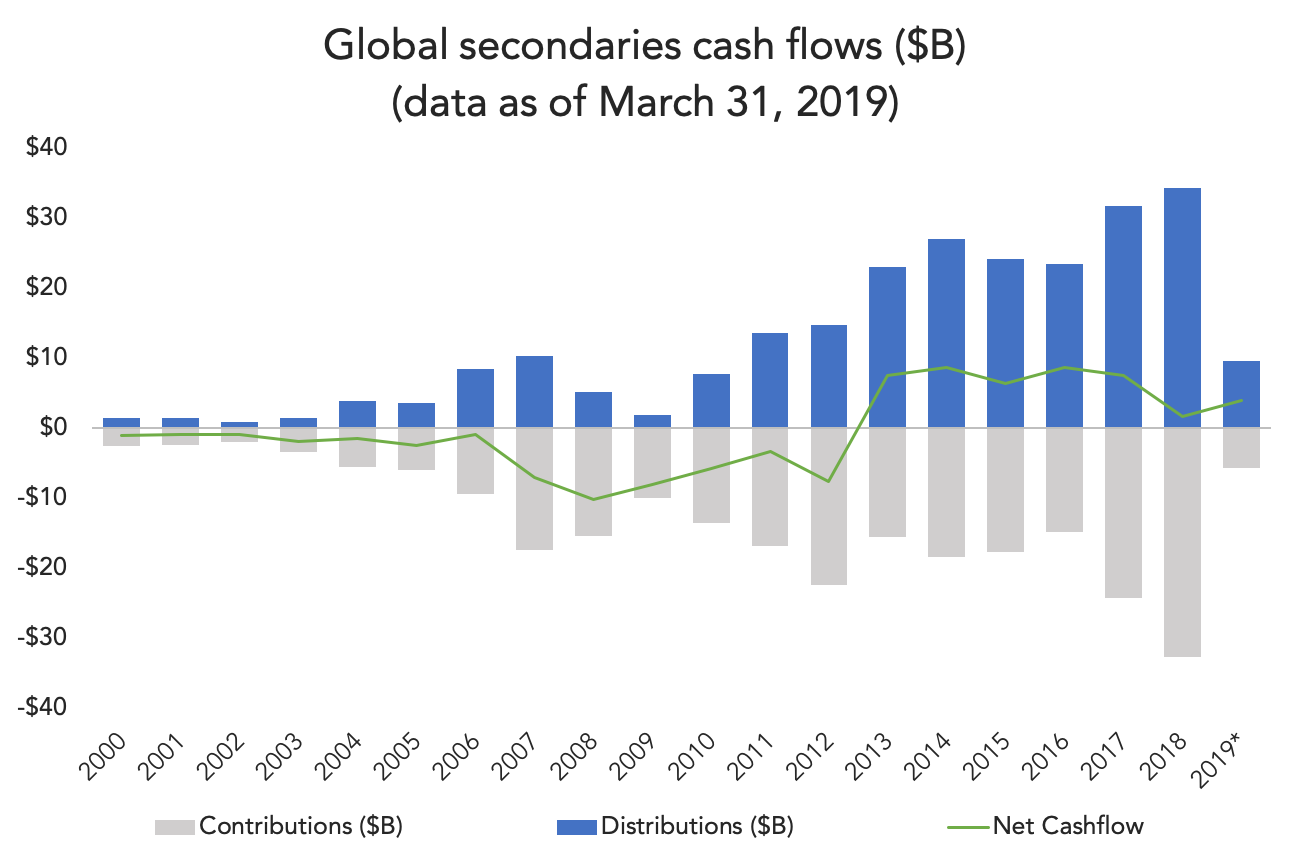
On deck this week is our all-time-high prediction for secondaries activity. We don’t track secondaries transactions directly, so we based last year’s prediction on retroactive contributions data. Noting that “aggregate contributions and distributions from secondaries hit record highs in 2017,” we predicted sustained momentum throughout 2018 and into 2019. Secondaries fund performance data indeed saw another record, with contributions hitting $32.6 billion in 2018 compared to $24.3 billion in 2017. Those numbers are as of March 31, the latest batch of performance numbers available to the market. Narrowing our definition to secondaries fund cash flows, our prediction turned out to be true, but it looks like others are seeing the same trend that we are.
Secondaries funds aren’t the only buyers running around, and transactions are hard to aggregate given the nature of the market. There are hundreds of other non-traditional buyers, including sovereign wealth funds and pensions, and getting a reliable temperature of transaction activity is tricky. Setter Capital produces one of the better market reports on the subject, and they saw strong numbers earlier this year. Using a survey-based estimate, they pegged H1 2019 secondaries activity around $46 billion. They also said that figure was conservative, since it didn’t include sovereign fund purchases at all.
Elsewhere in their survey, 54% of respondents “felt their volume was significantly higher” in H1 2019 compared to H1 2018. When we get the next batch of secondaries contributions data, the numbers might reflect that. It’s worth noting the secondaries funds have been levering to the tune of 45% this year, up from just 4% in 2013, according to Palico. The contributions data above doesn’t reflect that leverage. It’s a big market that’s getting significantly bigger.


Latest news

Share of PE middle-market deal count by backing type
Add-ons remain the workhorse for middle-market deployment, accounting for 67. 1% of all middle-market transactions YTD, in line with activity seen in recent years.

Software deal share falls in middle markets, rises in large caps
In Q3’26 software’s share of total deals fell in both the Lower Middle Market (to 7%) and Upper Middle Market (to 9%), while Large Cap saw a modest uptick in share to 8%.

Secondary loan prices stabilize following steep declines
Secondary loan prices came under significant pressure through September and October, with the Bloomberg U.S. Leveraged Loan Index declining 119…