



Download PitchBook’s Report here.
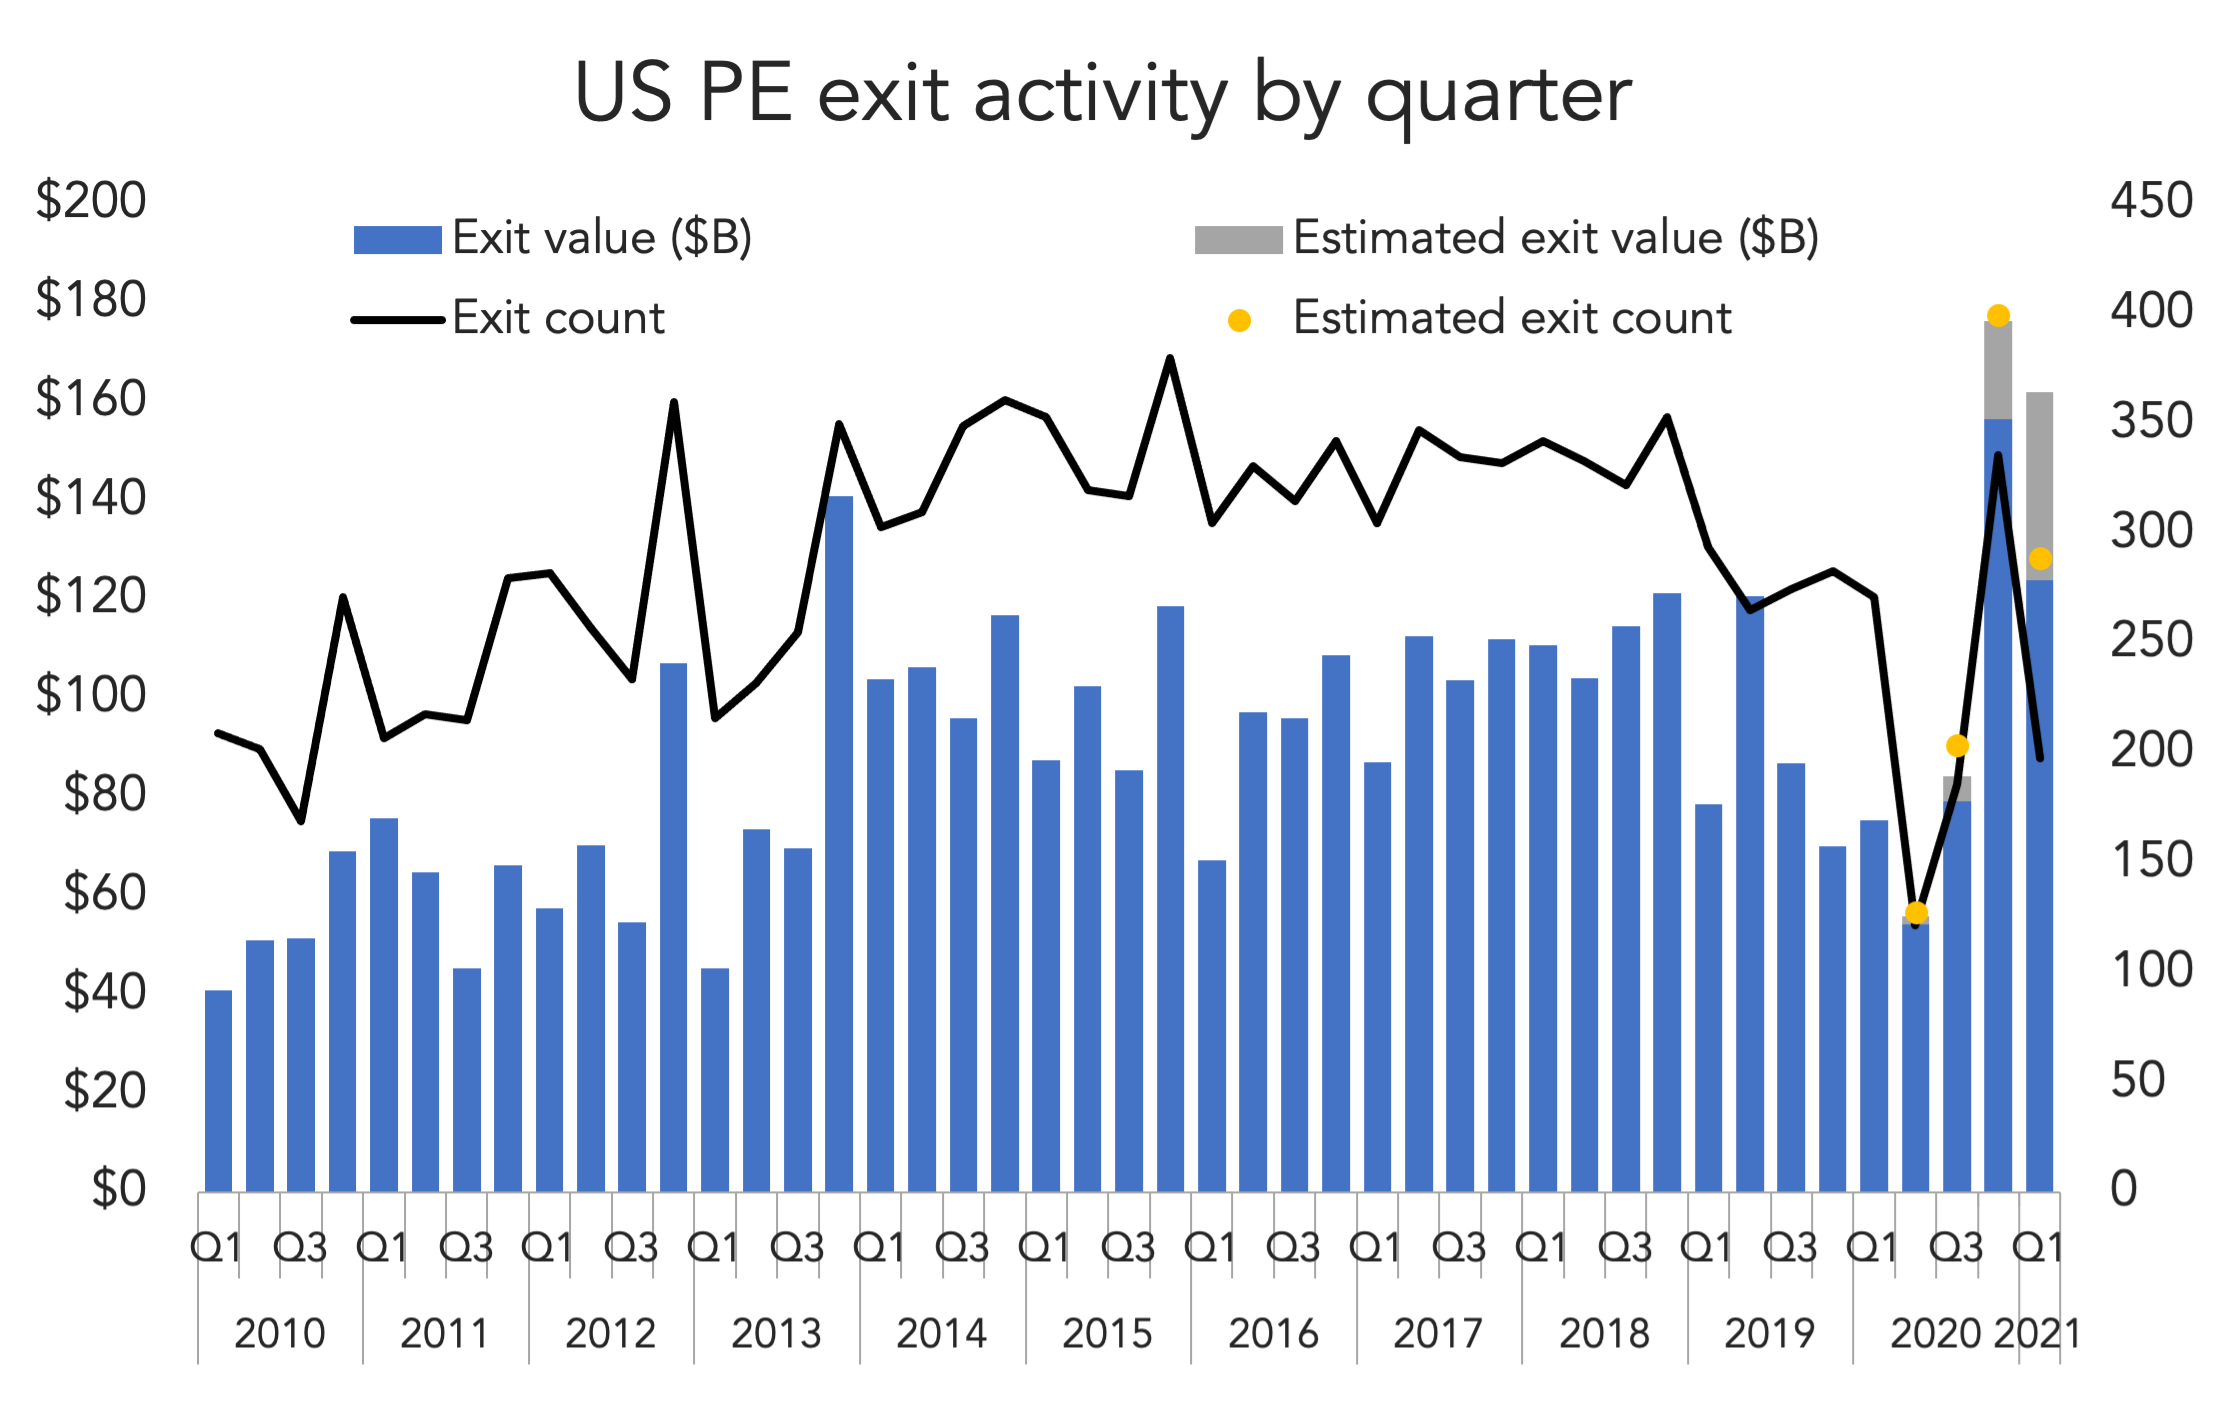
US PE exit activity continued its tear in Q1, according to PitchBook’s latest US PE Breakdown Report. Another $162 billion worth of exits was offloaded to start the year, not far off the record-setting fourth quarter of $176.3 billion. That adds up to $338.3 billion, more than the past four quarters combined. More than anything, the reverberating bounceback reflects pent-up exit demand, as 2020 plans were delayed due to unprecedented market conditions. Now that buy-side activity has rejuvenated, both from PE and strategic buyers, sell-side activity has sprung back to life.
The exit situation differs from the dealmaking one, which also saw two impressive quarters in Q4 and Q1. Any sustained boom in exit activity is limited to how many portfolio companies are ready for sale, while buy-side activity has a longer potential horizon over the next several quarters. In terms of the data, we’re more likely to see a pronounced (but temporary) boom in exits compared to dealmaking. As impressive as this two-quarter stretch is, it’s limited to healthier companies in healthier sectors. Portfolio companies in the software, healthcare and B2B spaces were able to recover and go to market faster. Portfolio companies in other markets—restaurants, hospitality, travel—are still in wait-and-see mode. Sponsors are loathe to sell at a heavy discount, and until those sectors open to full capacity, many investors will hold on to them and allow their EBITDA multiples to recover. That isn’t necessarily the case for dealmaking, where confident sponsors can take some risk by buying before the recovery has fully bloomed.
(Past performance is no guarantee of future results.)
Contact: Alex Lykken
alex.lykken@pitchbook.com




Latest news


PE fund distribution rates
Following 2021, buyout distribution rates have fallen to roughly 10% to 15% below the 25-year average.

Sub line pricing flattens
A report on the topic also finds that investors are less concerned by leverage in NAV loans. Pricing for subscription…