



Download PitchBook’s report click here.
Last week we highlighted our recent buy-and-build research, which found, among other things, that PE hold periods are significantly impacted by add-on deals. On average, platforms with add-on acquisitions take about one year longer to exit versus bare-bones platforms. That, in turn, has helped pushed out PE holding times to around five years on a median basis, up from around three to four years in the leadup to the financial crisis. “Strip and flip” is clearly a thing of the past.
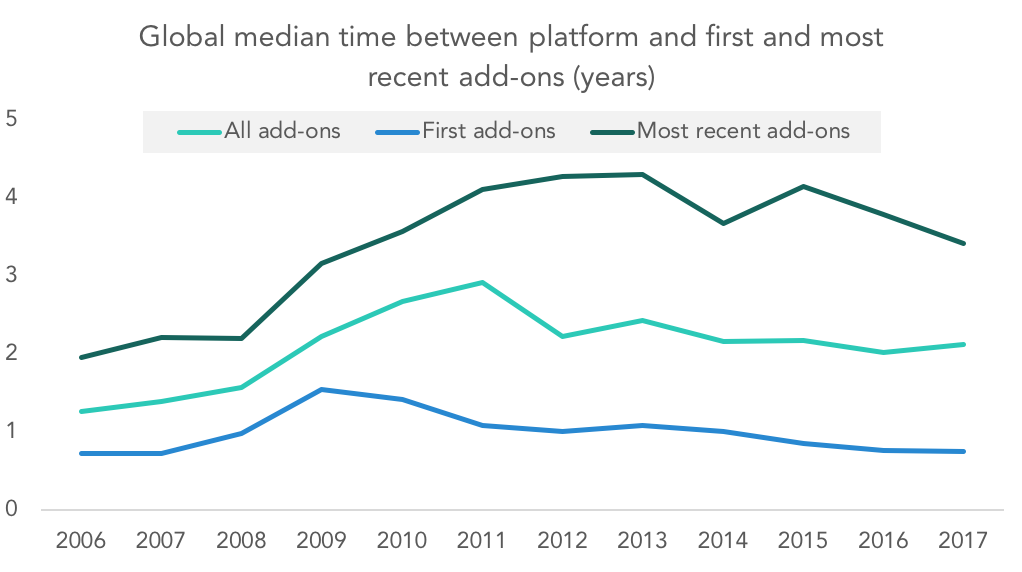
Add-on data offers a unique glimpse into the rapid transformation of the PE industry, which historically has moved at a glacial pace. The accompanying chart shows the median time between platform acquisitions and add-ons, split out between the first add-ons done (bottom blue line) and the most recent add-ons for the same platforms (top green line). It’s become common for PE sponsors to identify potential add-on acquisitions before buying their platform; in fact, it’s now necessary in the most competitive cases. That said, the push to add on quickly isn’t as new a phenomenon as many believe; it appears to have begun very quickly after the crisis, in fact. On a median basis, sponsors have waited about a year or less to add on going back to 2011. Given the time it takes to close any acquisition, the one-year mark can be rounded down closer to zero, or at least to the “first hundred days” mark.
On the other side of the coin, the time taken for second-and-later add-ons went down a different path in the same timeframe. In the aftermath of the crisis, late-cycle add-ons were done more than four years after the original platforms were acquired. We posit that, due to macroeconomic headwinds and post-crisis performance issues, PE sponsors turned to add-ons to boost platform revenues in a low-growth environment. And as we’ve discussed with the software space, late-cycle add-ons are often done to expand the platform’s offerings in response to ever-changing consumer demands. While both of those points have visibly contributed to the “most recent” add-on data, the numbers have been trending downward since 2013. The broader takeaway is that even late-cycle add-ons are being completed earlier today compared to 2008-2012. In other words, the buy-and-build strategy is much more deliberate—i.e. less reactionary—in the current market.
Contact: Alex Lykken
alex.lykken@pitchbook.com


Latest news

Share of PE middle-market deal count by backing type
Add-ons remain the workhorse for middle-market deployment, accounting for 67. 1% of all middle-market transactions YTD, in line with activity seen in recent years.

Software deal share falls in middle markets, rises in large caps
In Q3’26 software’s share of total deals fell in both the Lower Middle Market (to 7%) and Upper Middle Market (to 9%), while Large Cap saw a modest uptick in share to 8%.

Secondary loan prices stabilize following steep declines
Secondary loan prices came under significant pressure through September and October, with the Bloomberg U.S. Leveraged Loan Index declining 119…