



Download PitchBook’s Report here.
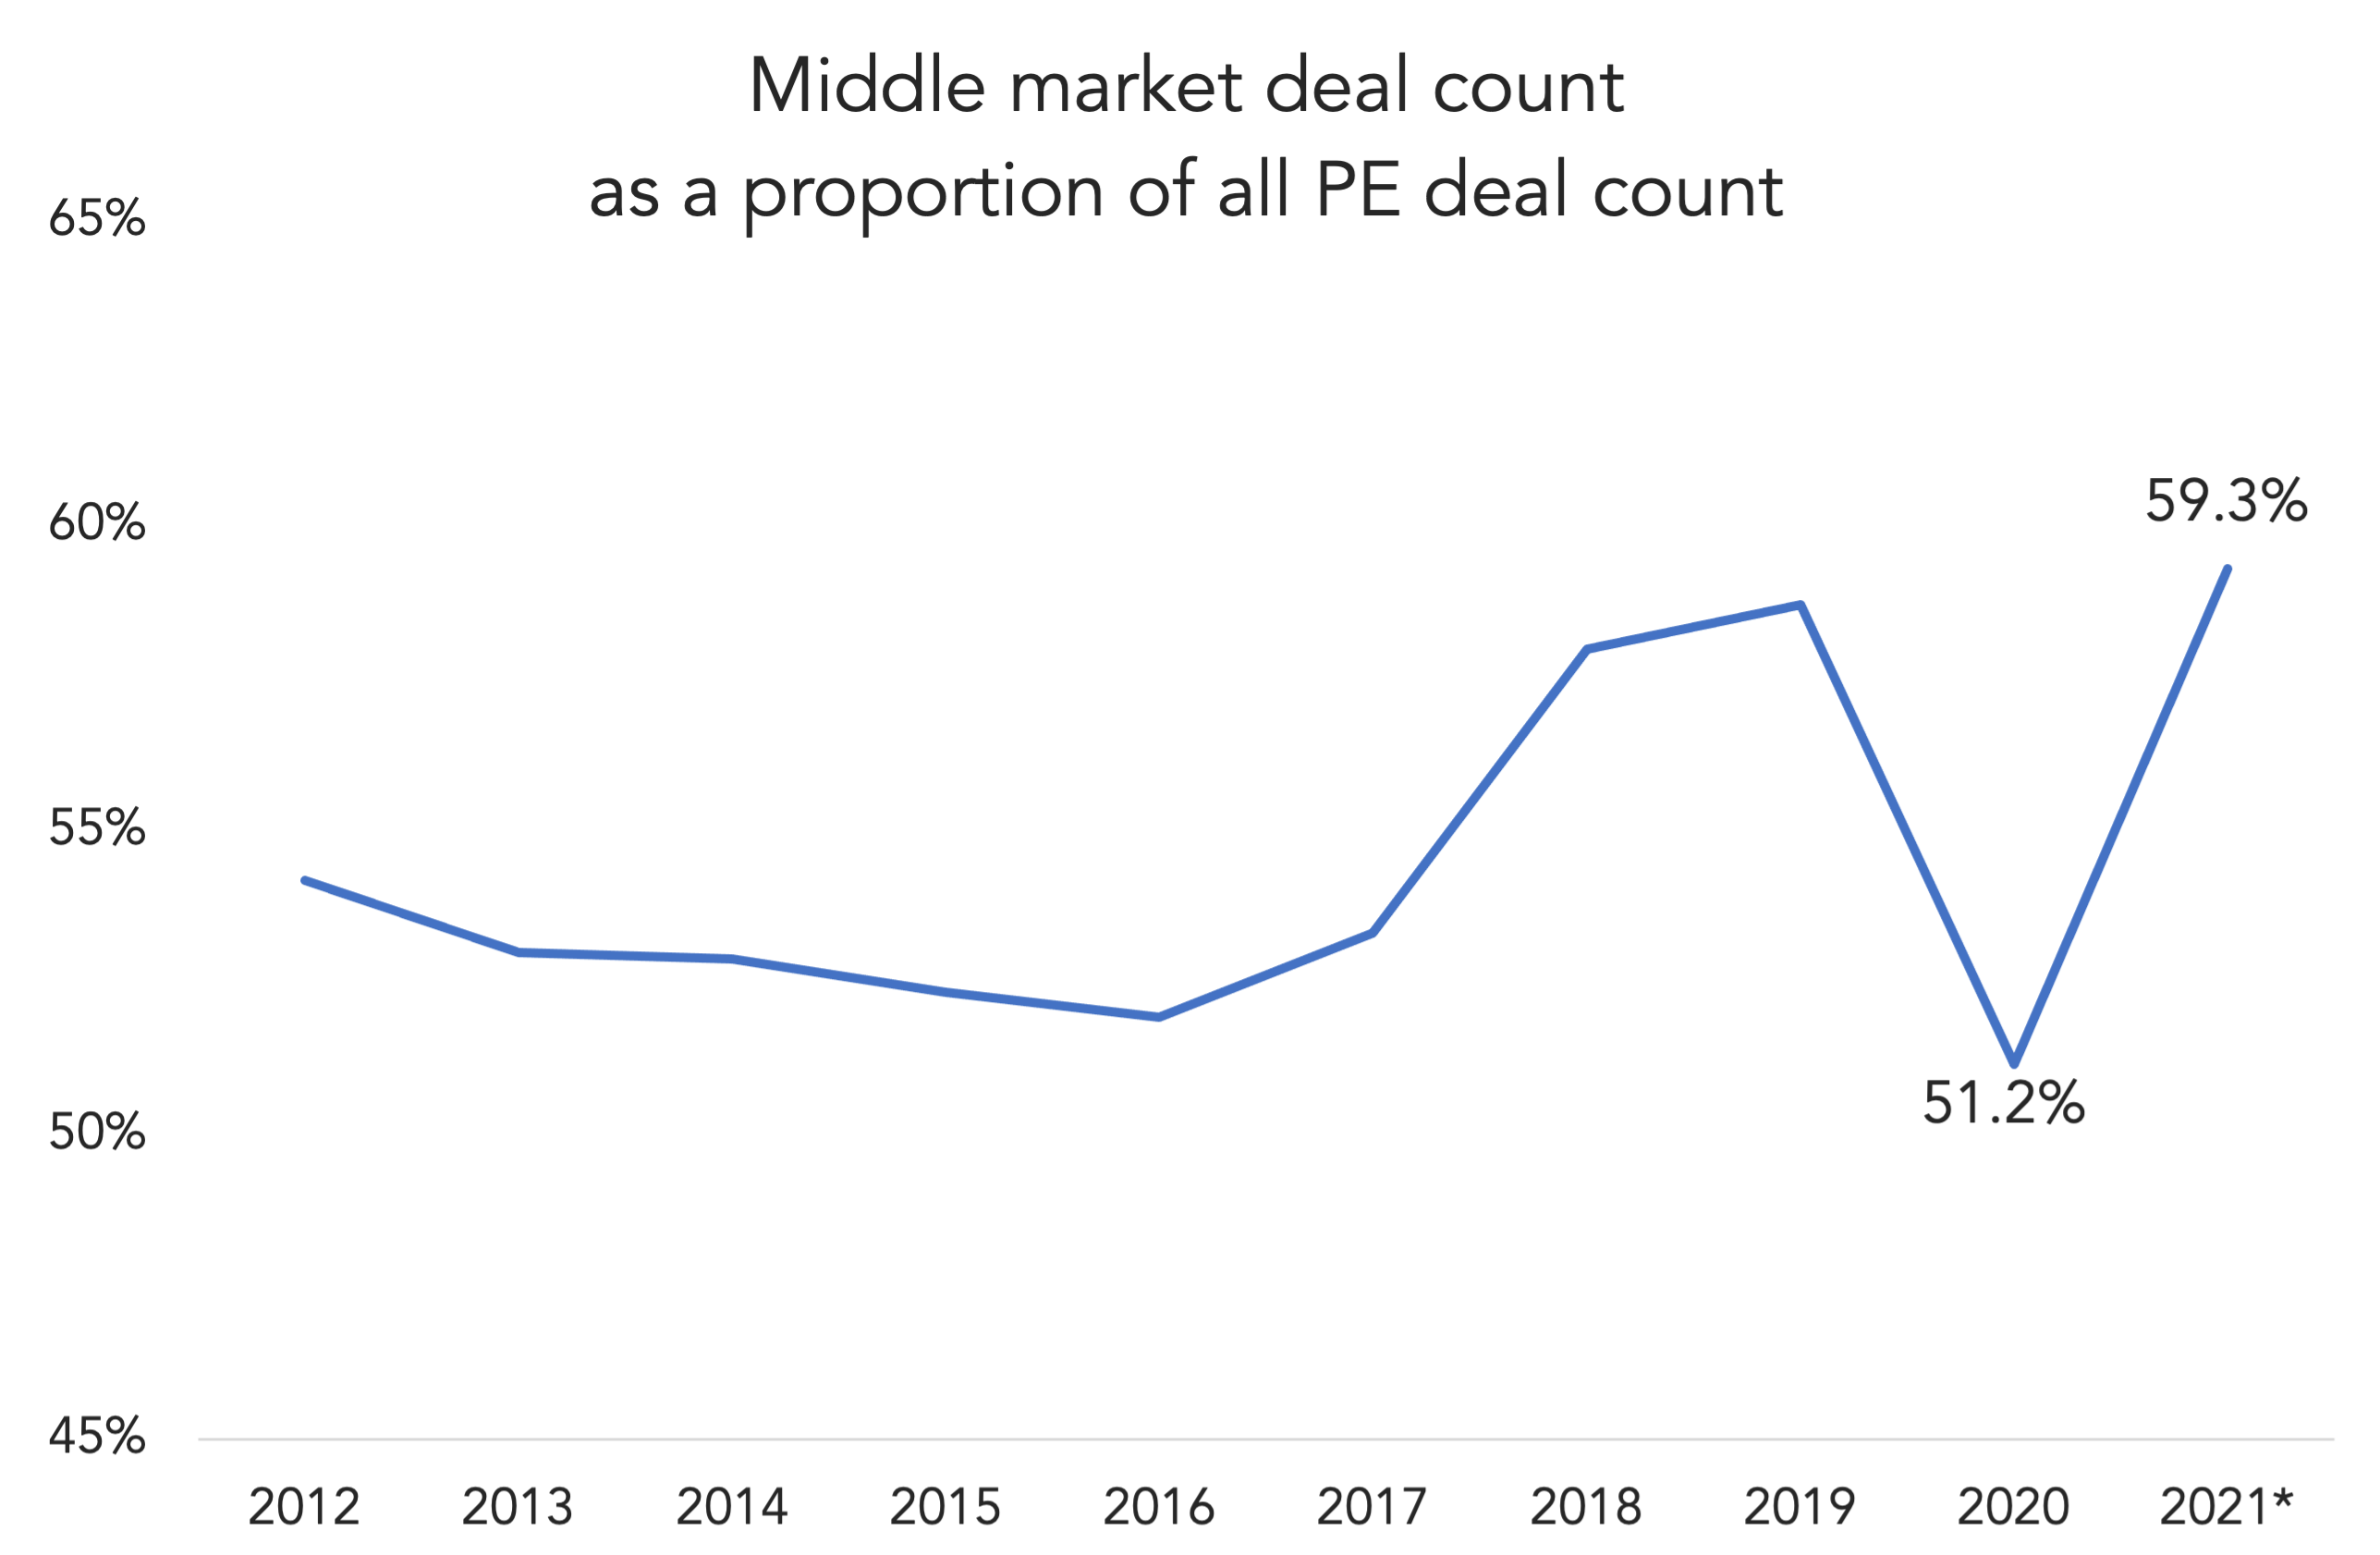
Another tidbit in PitchBook’s 2021 Annual Middle Market Report is the chart above. It reflects the proportion of all US PE deal flow being done in the middle market. For most of the decade, the middle market’s share of overall deal flow hovered just above 50%. Starting in 2018, however, it rose to nearly 60% of all deal flow, and three of the last four years have been near that ratio. The one exception is 2020, which dropped dramatically in 2020 before revving back up in 2021.
According to PitchBook’s 2021 Annual US PE Breakdown—which covers the whole waterfront—overall PE deal flow declined by less than 1% in 2020. Middle market deal flow, on the other hand, dropped by 15%, from 2,775 deals in 2019 to 2,372 deals in 2020. The end result was a sharp, one-year chasm in proportionality. From a bird’s eye view, it looks like the middle market was more hesitant compared to other PE segments in 2020. Deal flow in the $100m-$500m range, for example, declined by 18% versus -0.8% overall. The 2021 recovery was a different story: Deal flow in the $100m-$500m range jumped by 72% in 2021 versus a 51% increase for overall deal counts.
(Past performance is no guarantee of future results.)


Latest news

Share of PE middle-market deal count by backing type
Add-ons remain the workhorse for middle-market deployment, accounting for 67. 1% of all middle-market transactions YTD, in line with activity seen in recent years.

Software deal share falls in middle markets, rises in large caps
In Q3’26 software’s share of total deals fell in both the Lower Middle Market (to 7%) and Upper Middle Market (to 9%), while Large Cap saw a modest uptick in share to 8%.

Secondary loan prices stabilize following steep declines
Secondary loan prices came under significant pressure through September and October, with the Bloomberg U.S. Leveraged Loan Index declining 119…