



Download PitchBook’s Report here.
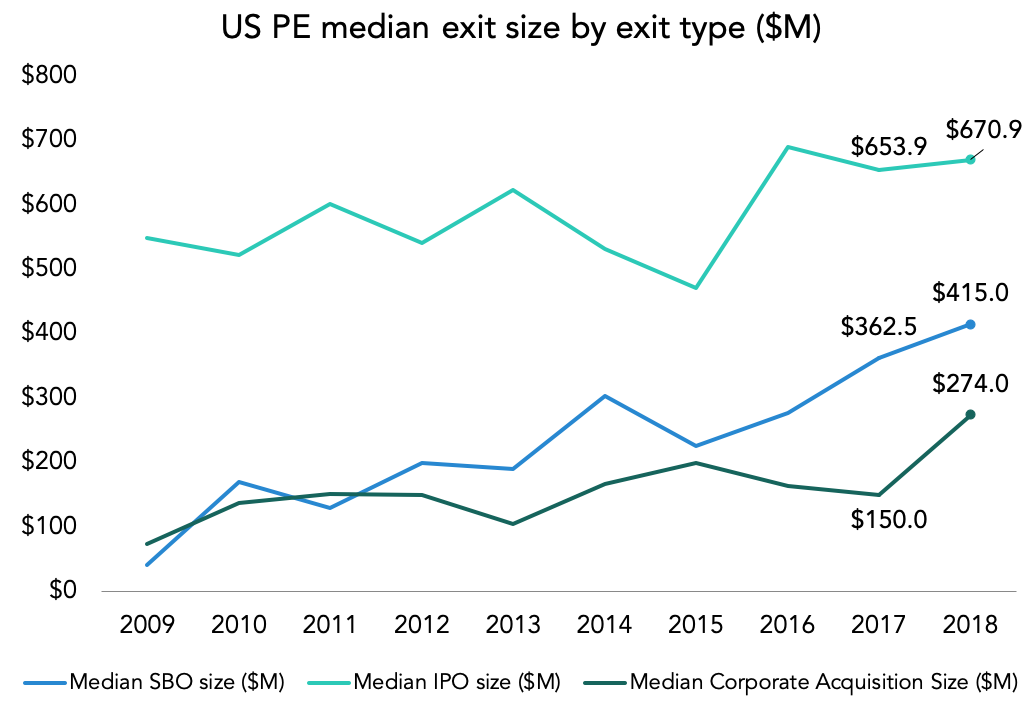
Private equity has three major exit ramps—strategic sales, secondary buyouts and IPOs. They tend to trend independently of one another, which is to say that market dynamics usually favor one or two options over another. Exit prices split out by type are indicative of how much demand is built in for each. IPO volume is tiny compared to outright sales, but there is some insight to glean from acquisitions and SBOs.
For sellers, outright sales end with the same result—a check covering the full amount of the exit. We’ve discussed in the past that strategic acquisitions have their own logic to them. Corporate M&A doesn’t happen in a vacuum; each deal needs to achieve something for that particular acquirer. It’s the difference between shopping for the sake of it and going to the store to buy something specific. Corporate America doesn’t do the former. Private equity firms do, to some degree, when they a lot of money to spend and a mandate to spend it. That’s one way of looking at the chart above, in particular the widening gap between SBO and strategic acquisition exit prices. In the span of four years, the median SBO exit size has almost doubled, from $225 million in 2015 to $415 million last year. A glass-half-full interpretation is that PE-backed companies have grown in value over that timespan, which ought to be true if the first investors did their job in creating new value. A second interpretation is that PE-backed companies have simply become more valuable to other private equity firms. Certain companies and business models are more conducive to PE ownership than others, according to several studies, some going back to the 1980s. If those cases are happening in large enough numbers to impact current trends, it stands to reason that SBO exit prices are heading north as well. From the lower-middle-market on up, there are more funds in play, with more capital than ever, to fuel secondary buyout activity for the foreseeable future.
Contact: Alex Lykken
alex.lykken@pitchbook.com







Private Credit Defaults 101: Back to School
As Labor Day approaches, the unofficial end of summer is upon us. But, before we get too sad, there is also the familiar back-to-school energy.