



Download PitchBook’s Report here.
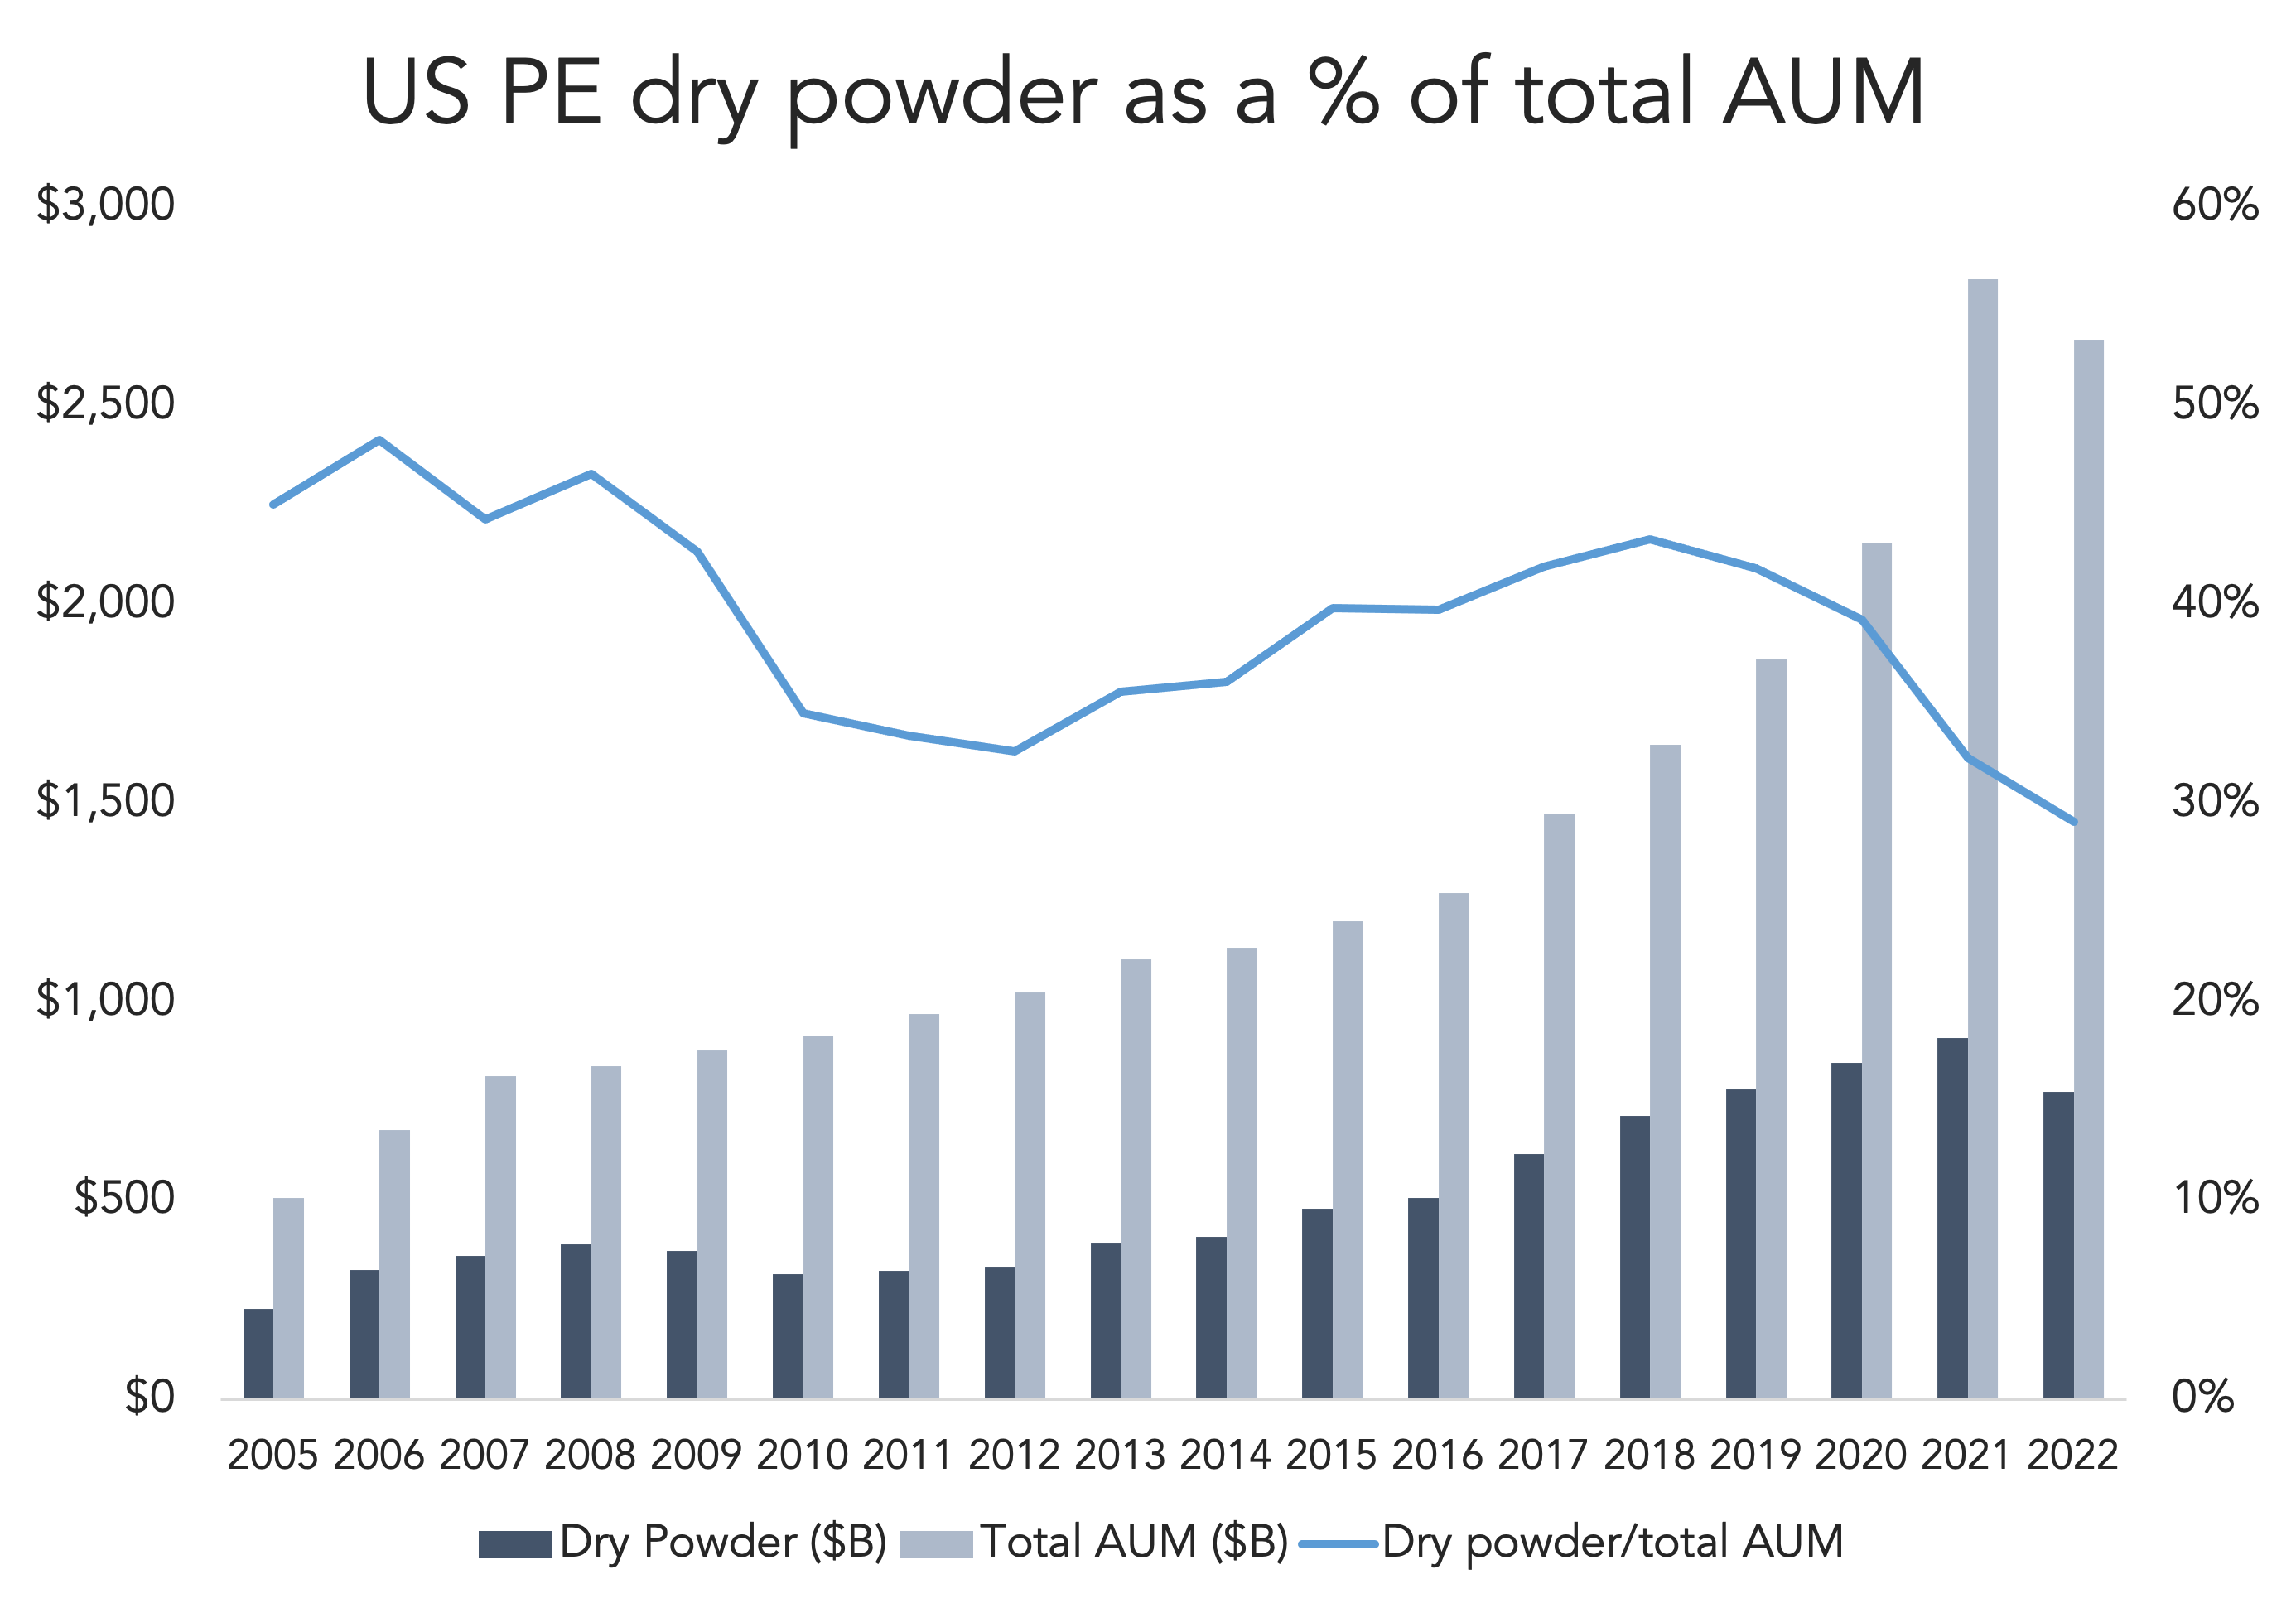
As much dry powder is floating around the PE market, the mountain is shrinking at the moment. According to PitchBook’s Q1 2023 US PE Breakdown, unspent capital accounts for less than 30% of total PE AUM. It’s the first time in two decades where that metric has been that low. As recently as 2020, dry powder accounted for 39% of PE AUM, but that percentage fell swiftly as investment activity ratcheted up. In 2021, total dry powder was $911 billion, which fell to $776 billion a year later—a $135 billion drop and the first YoY decrease since 2009-10.
At the end of the day, though, the amount of dry powder available in 2022 was about the same as it was in 2019. Times were good in 2019; things are trickier today. Even though dry powder levels are down, they remain high, and dealmaking isn’t going at the same pace as it did four years ago.
(Past performance is no guarantee of future results.)



Latest news

US Leveraged Loans Return 3.36% to Investors YTD
The Bloomberg US Leveraged Loan Index (Ticker: LOAN) returned 0.96% in August and has gained an additional 0.28% through September…

PE dry powder
The capital that is being raised is flowing overwhelmingly to the largest, most established managers.

Middle market debt held by BDCs vs High yield vs Treasury yields
The blue line represents the current dividend yield of the VanEck BDC Income ETF (BIZD), which stood at 11.7% as…