



Download PitchBook’s Report here.
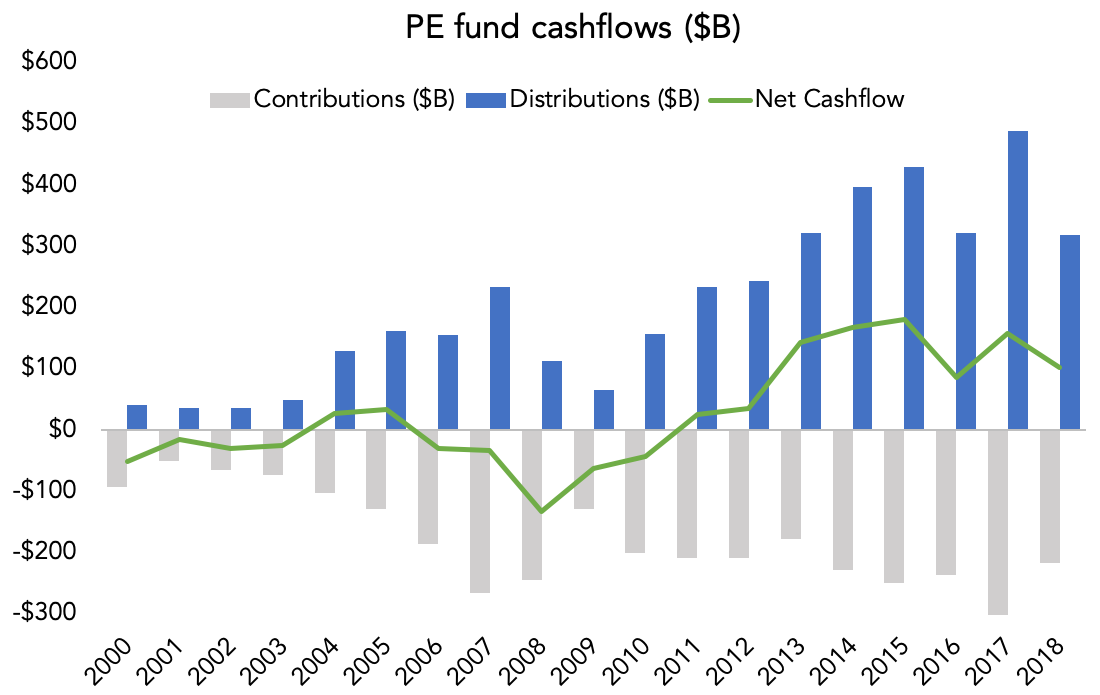
Private equity net cash flows are on pace for an eighth consecutive year in positive territory. Through Q3 2018 (the most recent data available), net cash flows (the difference between contributions and distributions) remained just above $100 billion. One more quarter’s worth of data to sift through when it comes in, but the tea leaves bode well—exits were strong in Q4, which should be more than enough to keep net cash flows safely in the black.
It’s been a great run so far. Since 2011, LPs as a whole have had more money coming in than going out, which has been a tailwind for fundraising. Net cash flows peaked in 2015 at +$181 billion, and after a +$85 billion year in 2016, net cash flows bounced back up to +$157 billion in 2017. The trend looks like something of a downshift, though, and eventually net cash flows will fall back into negative territory. But several PE-related asset classes have their own positive streaks still intact, including secondaries (positive since 2013) and funds-of-funds (since 2012). PE distributions are coming off a record year in 2017, which saw almost $490 billion recycled back to LPs in a single year. That was only the second $400B+ performance in the industry’s history, but 2018 numbers are on pace to do it again. That bodes well for near-term fundraising. Expect contributions (ie capital calls) to grow commensurately due to a surfeit of dry powder floating around in the market.





Latest news

Rate hike expectations ease as term SOFR curve flattens
The CME six-month Term SOFR rate reached a recent high of 3.979% on July 28 before retreating to 3.837% as…

3Q26: New loan assets rise to 44% of total lending, a 3-year high
New loan assets as a proportion of total US loan volume make up 44% of the 3Q26 pipeline to date,…

North American GPs dominant as fundraising accelerates
Our PEI Private Credit 200 ranking also shows capital raising increasing overall – and accelerating especially fast for the largest…