



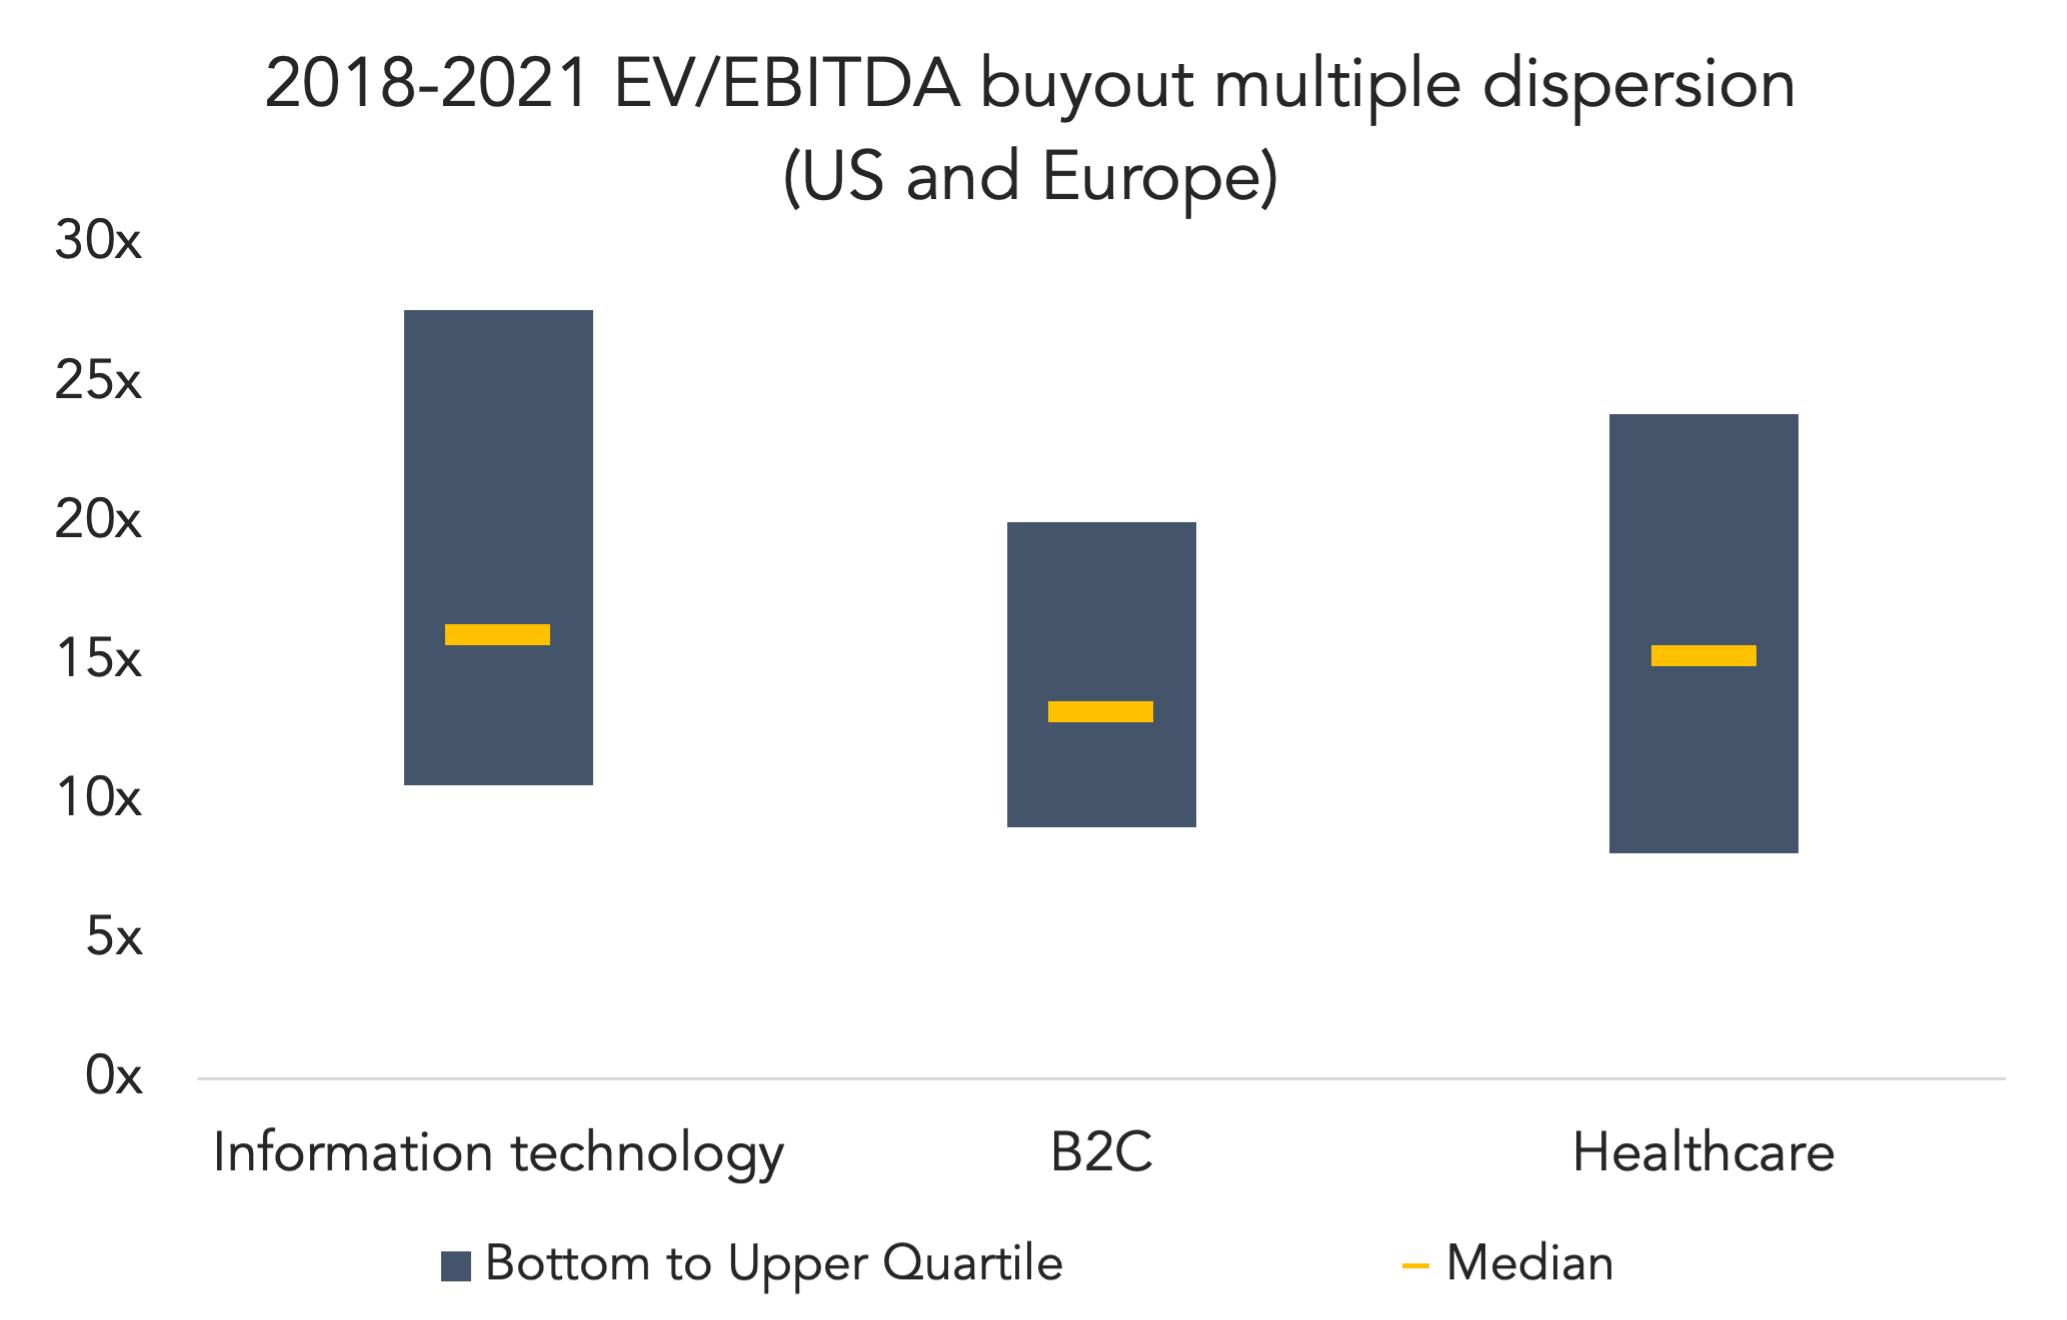
PitchBook’s latest analyst note, released tomorrow, takes a close look at buyout multiples across the IT, healthcare and consumer spaces. The pandemic had material and divergent impacts on IT and consumer—the 2020 median multiple for IT rose to 20.1x, up almost five turns from 2019’s median of 15.3x. IT buyouts are almost twice as expensive as they were in 2012, when the median multiple was 10.3x. Over the past two years, we’ve seen individual buyouts reach stratospheric buyout multiples—Thoma Bravo’s $10.2B deal for RealPage hit a TTM multiple of 39.8x. The same firm took Majesco private last September for a TTM multiple of 34.7x. Multiples north of 20x are found across all three sectors. While pricey, those levels are required for auctioned assets that proved resilient under quarantine.
The consumer space, predictably, saw multiples plunge in 2020. The median fell from 13.7x in 2019 to 10.4x last year, reversing almost a decade of year-over-year increases. There will be a course correction as the world re-opens. The bigger question facing the consumer space, however, is the psychological impact Covid had on spending. Did the average consumer permanently change their spending habits, and in what ways? Companies that can prioritize “anywhere, anytime” commerce, direct-to-consumer distribution channels and optimal supply chain efficiency will see their fortunes rise post-Covid. PE firms targeting the sector will need to pay up for companies that have figured out their consumers and kept them happy.
(Past performance is no guarantee of future results.)



Latest news

US Leveraged Loans Return 3.36% to Investors YTD
The Bloomberg US Leveraged Loan Index (Ticker: LOAN) returned 0.96% in August and has gained an additional 0.28% through September…

PE dry powder
The capital that is being raised is flowing overwhelmingly to the largest, most established managers.

Middle market debt held by BDCs vs High yield vs Treasury yields
The blue line represents the current dividend yield of the VanEck BDC Income ETF (BIZD), which stood at 11.7% as…