



Download PitchBook’s Report here.
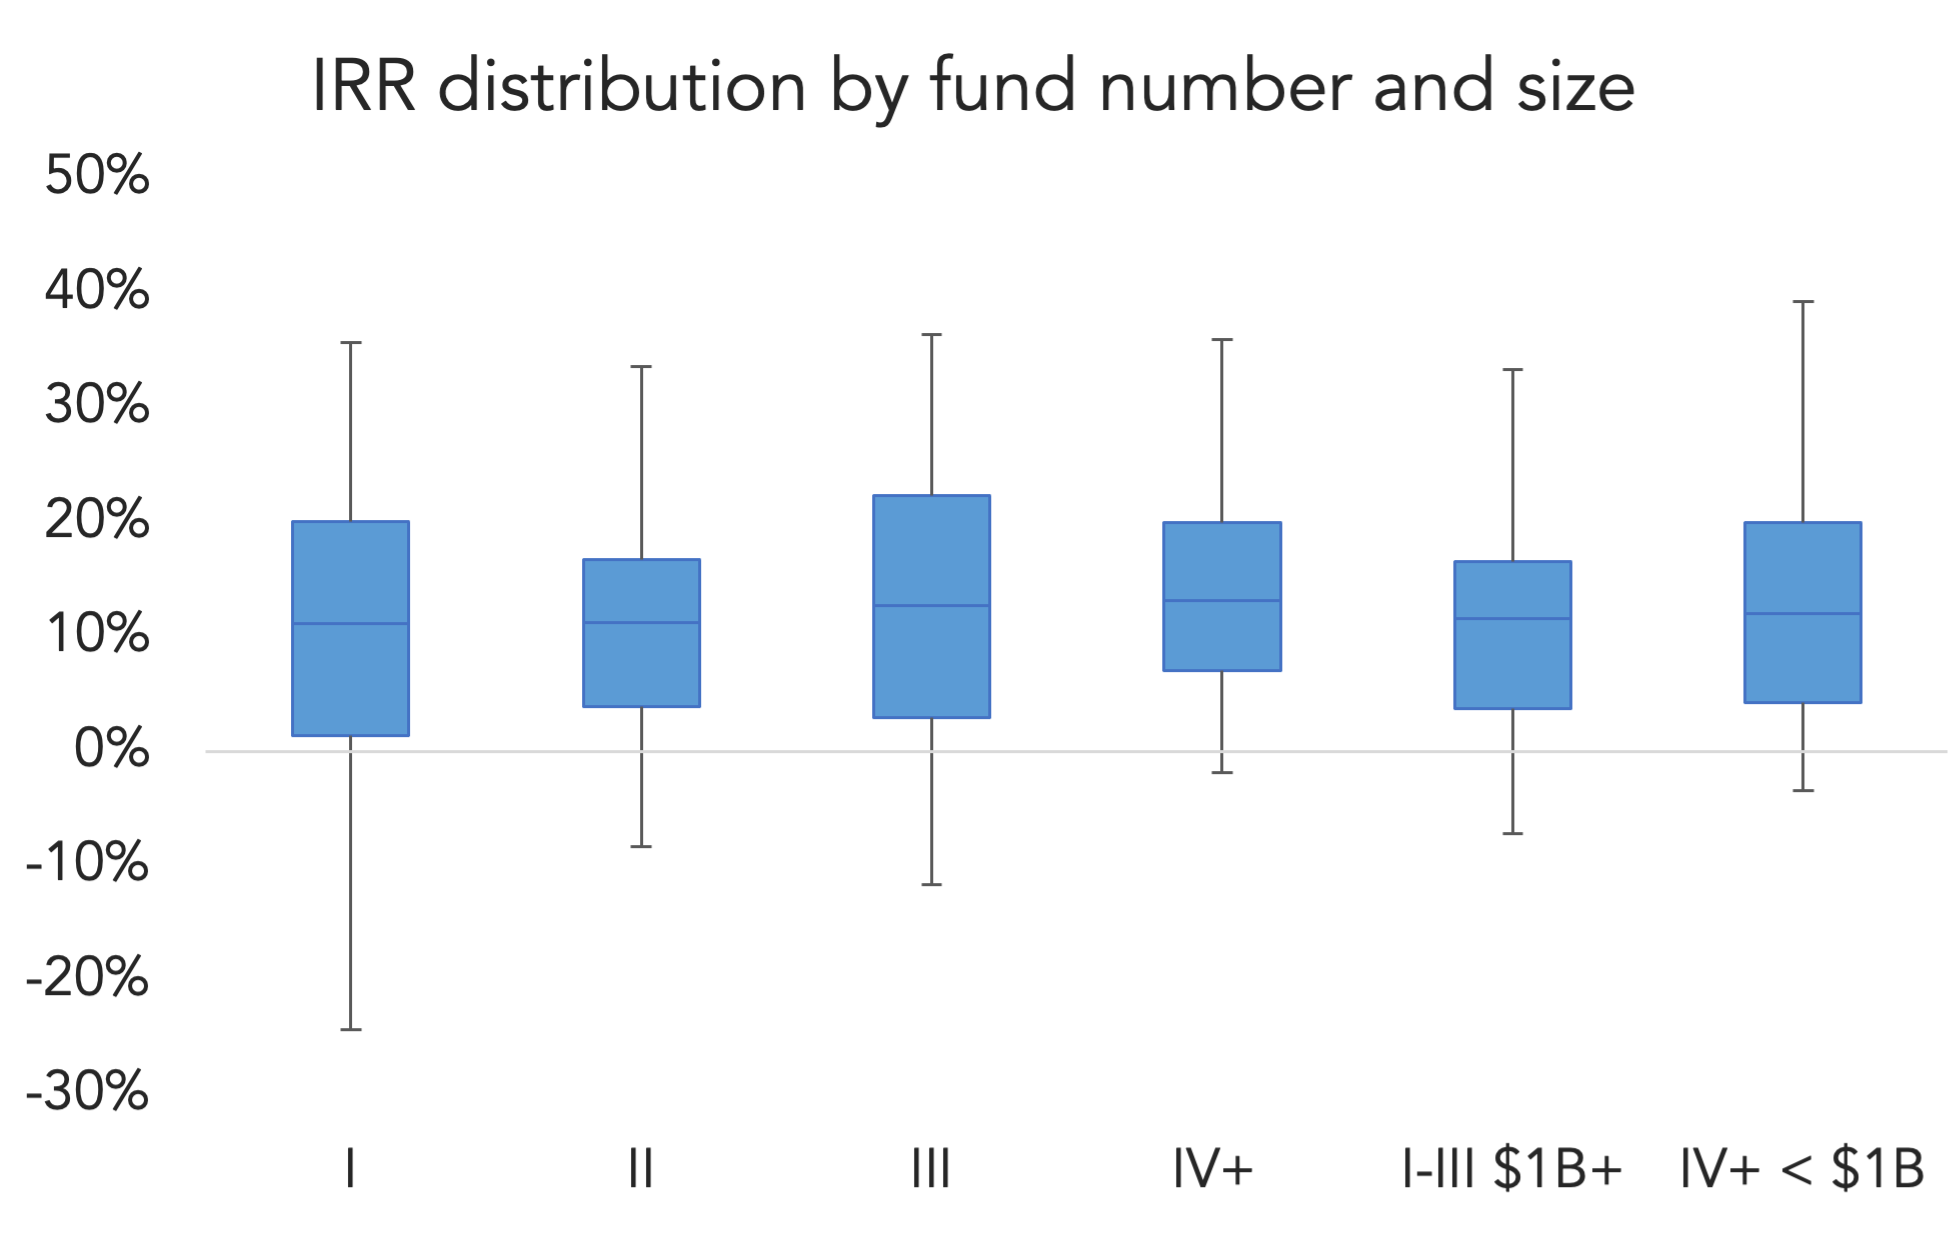
A new PitchBook analyst note, Beyond Fund I, dives into several emerging manager topics. A few surprises stood out. The chart above, for example, shows fairly static performance between a manager’s first fund and subsequent ones. Debut funds do, though, see the most performance variation compared to later funds, at least on an IRR basis. Debut funds perform better on a TVPI basis, however, suggesting that many first-time managers underutilize capital call facilities and dividend recaps, at least compared to more seasoned managers. The numbers suggest a small sophomore slump, with Fund IIs slightly underperforming debut funds.
We also noticed little differentiation in step-ups between smaller and larger first-time funds. There’s a belief that smaller emerging managers begin to scale up at a faster pace. In theory, it should be easier to double a $100 million fund than a $1 billion fund. Our numbers, however, suggest that ambition starts earlier than Fund II. The sweet spot appears to be in the $500 million range, many of which are well-known spinouts that are aiming bigger right away. It helps that those types of managers already have relationships with prominent LPs that can write bigger checks. As a whole—including small, big and mid-sized managers—the biggest step-up within fund families is between the first and second fund. Given that many LPs are hesitant to back emerging managers at all, that isn’t surprising. In cases where a manager’s debut fund went swimmingly, those same LPs won’t be hesitant to commit to their next fund.
(Past performance is no guarantee of future results.)




Latest news

US Leveraged Loan Launches Exceed $30b in post-Labor Day Rush
The US leveraged loan market recorded $24.6b of new launches on Tuesday, September 8, marking the busiest post-Labor Day surge…


PE fund distribution rates
Following 2021, buyout distribution rates have fallen to roughly 10% to 15% below the 25-year average.