



Source: Debtwire Par
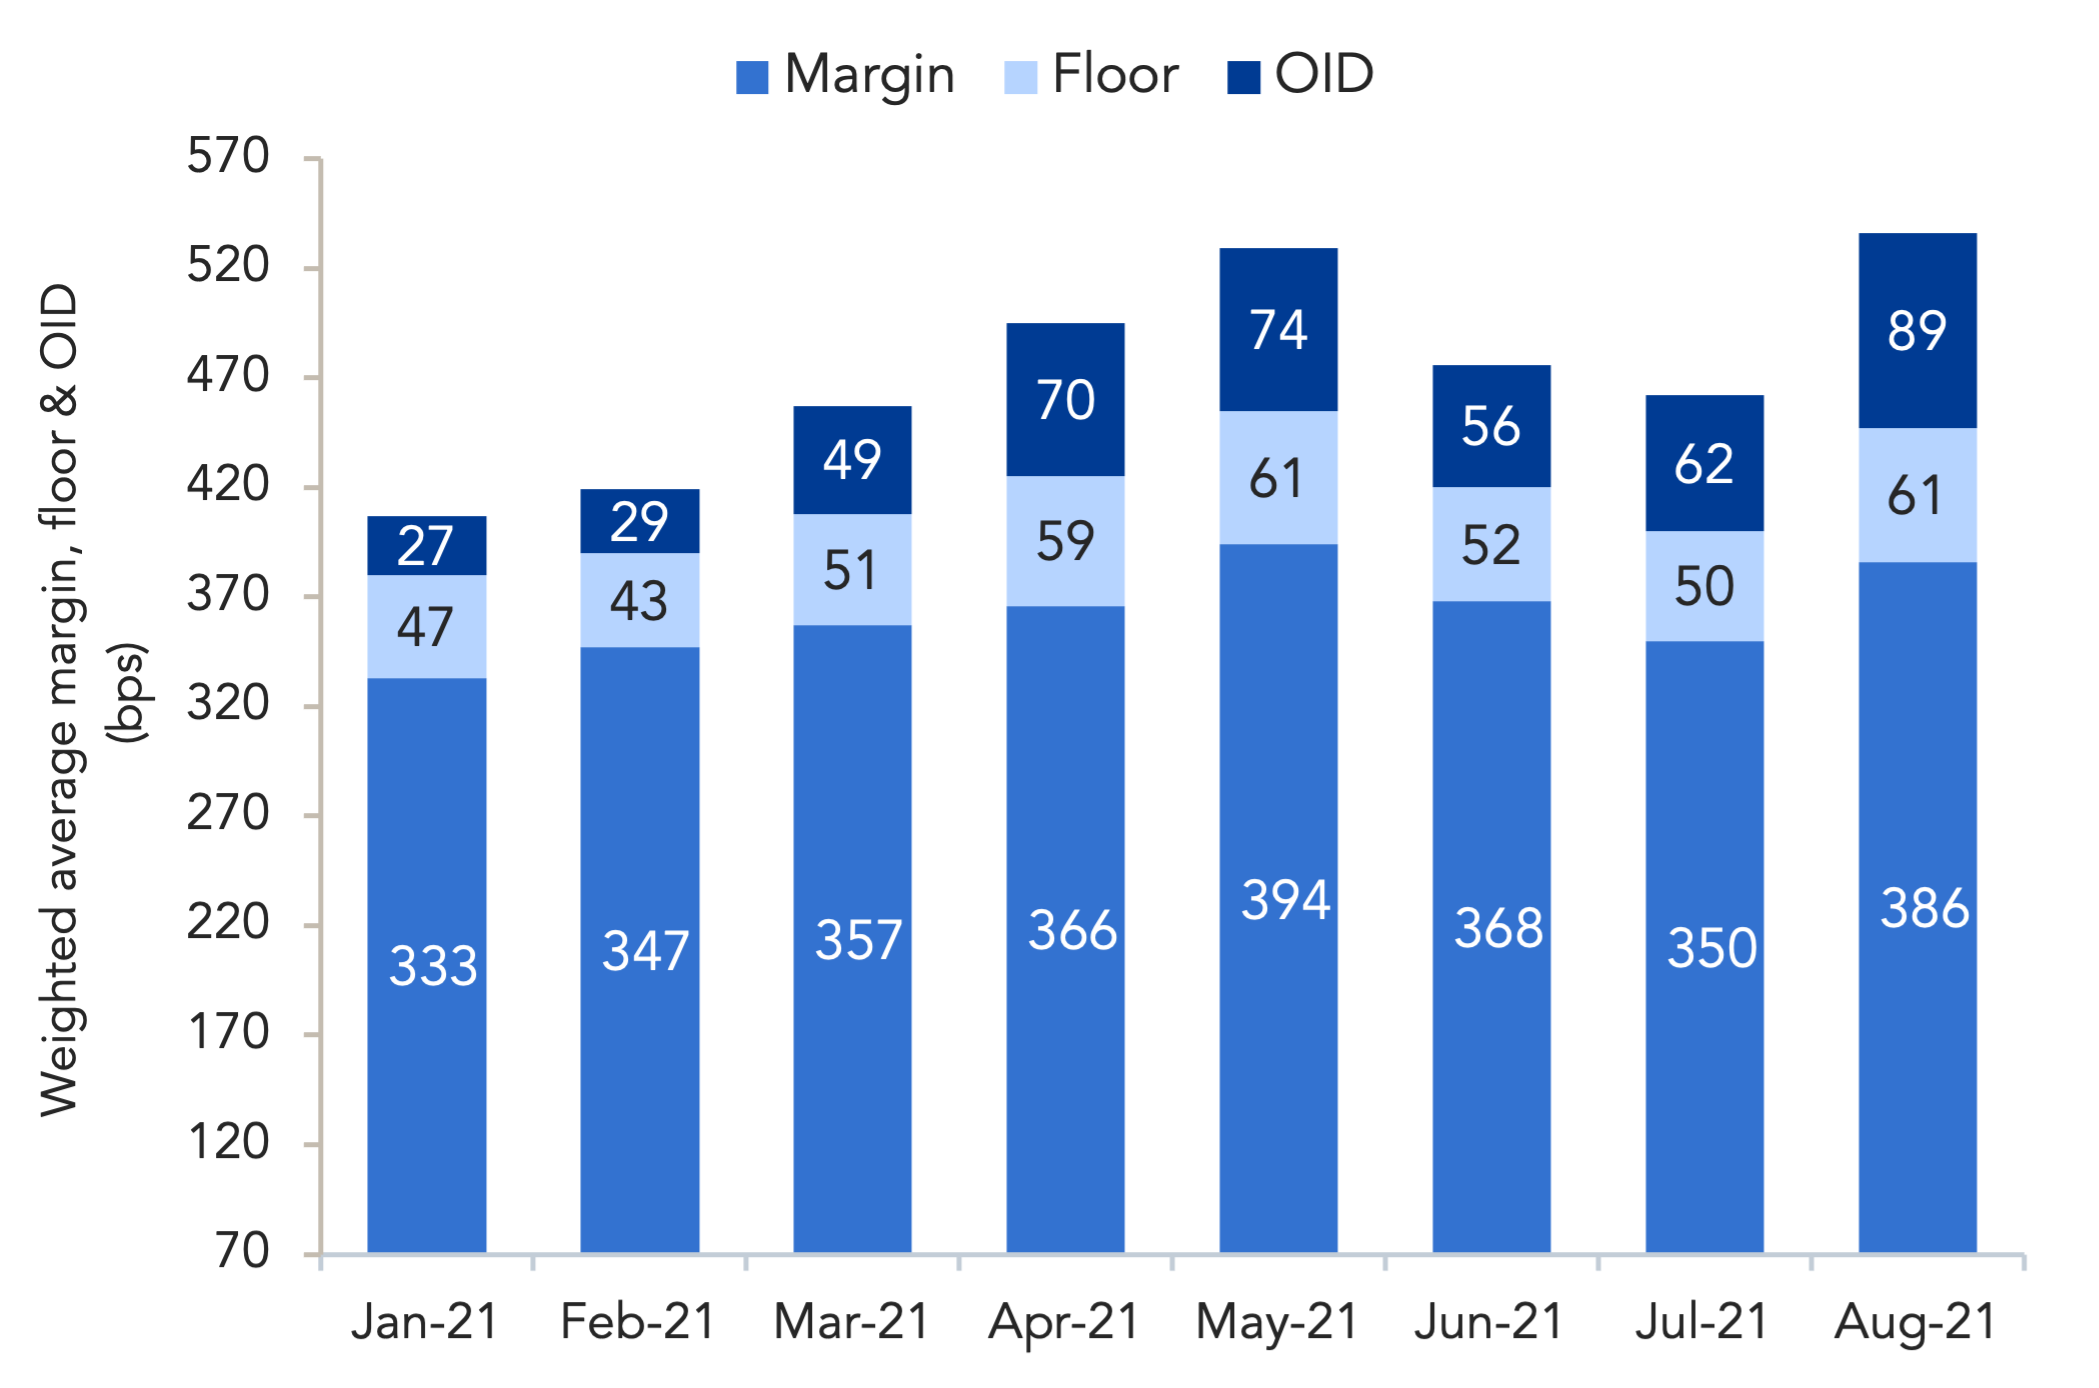
To begin the year, a surge of repricing and refinancing activity helped to push loan pricing to historically tight levels – in January, when repricing volume spiked to USD 43.2bn, average margins on institutional first lien loans fell to just 333bps, with yields averaging 3.92%. In August, repricing volume was a mere USD 0.5bn as Sotheby’s was the only issuer to reprice an existing facility.
Institutional loan issuance declined 40% month-over-month to USD 50.5bn, its lowest level this year, though year-to-date volume is up 87% to USD 663.5bn. While the monthly slowdown was felt across the market, institutional loan issuance for new money purposes was strong, accounting for 72% of August deal flow, the highest proportion of new money activity yet this year. While monthly issuance still fell 25% from the July high, buyout and M&A activity remained strong, at USD 15.4bn and USD 14.3bn, respectively. With an abundance of new paper and few refinancings in August, pricing was pushed higher.
Average margins landed at 386bps in August, while LIBOR floors and OIDs (original issue discounts) both hit yearly highs of 61bps and 89bps respectively. The cumulative effect has been to push loan yields to their widest level this year at 4.69%.
(Past performance is no guarantee of future results.)




Latest news

US leveraged loans returns turn negative in October
The Bloomberg US Leveraged Loan Index (Ticker: LOAN) has returned -0.26% this month through October 21, reducing its year-to-date return…

M&A activity begins to tick upward
In the third quarter of 2026, acquisition-linked loan volume across North America and Europe reached about $47 billion, up from $30.6 billion in Q2 and $29.5 billion a year ago.
