



Mezzanine volume in the middle market only reached about $800 million in 3Q15, over 30% lower than the $1.2 billion tracked in 2Q15. Over the years, mezzanine has been pushed down market and has been more commonly structured on lower middle market issuers with less EBITDA and less leverage. With purchase price multipes at record levels, middle market sponsors were more inclined to choose second lien or unitranche this past quarter. 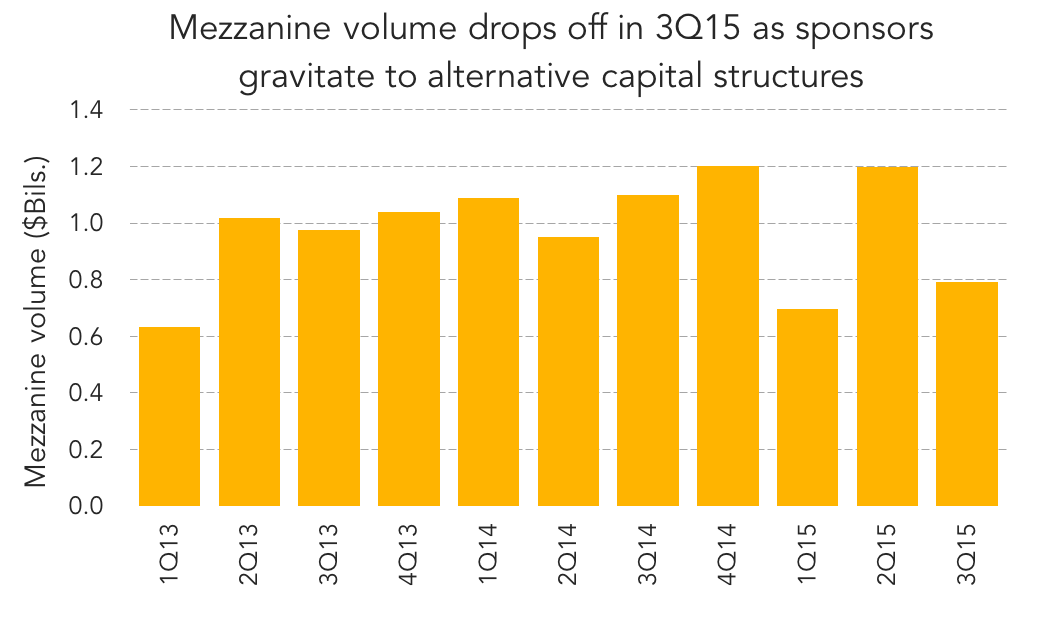 Second lien is more cost effective than mezzanine with an average yield of around 10.11% in 3Q15 versus 12.7% for mezzanine in the same period. Furthermore, the average leverage levels on first lien/second lien deals seem to be higher than first lien/mezzanine deals making it a more enticing choice for sponsors paying lofty valuation multiples. Sponsors also favored the unitranche this past quarter given global macro volatility. Despite paying a slight premium for a unitranche, sponsors who are very focused on buyouts and takeover deals lean on the unitranche for certainty of close during periods of market turmoil. Furthermore, given more lenders are offering unitranche now as a product, unitranche yields showed a tightning in 3Q15 to only 8.3% from 8.8% in 2Q15.
Contact: Fran Beyers
frances.beyers@thomsonreuters.com




Latest news

US leveraged loans returns turn negative in October
The Bloomberg US Leveraged Loan Index (Ticker: LOAN) has returned -0.26% this month through October 21, reducing its year-to-date return…

M&A activity begins to tick upward
In the third quarter of 2026, acquisition-linked loan volume across North America and Europe reached about $47 billion, up from $30.6 billion in Q2 and $29.5 billion a year ago.
