



Leverage on large corporate LBO deals came down modestly in 4Q14 as market players are responding to regulators’ feedback around Leveraged Lending Guidance. The average debt to EBITDA in 4Q14 for large corporate LBO financings is currently 6.53 times, down from 6.96 times in 3Q14.And outlier TIBCO Software is driving up the metric this past quarter given its estimated leverage of 11 times based on a LTM EBITDA of $239 million. 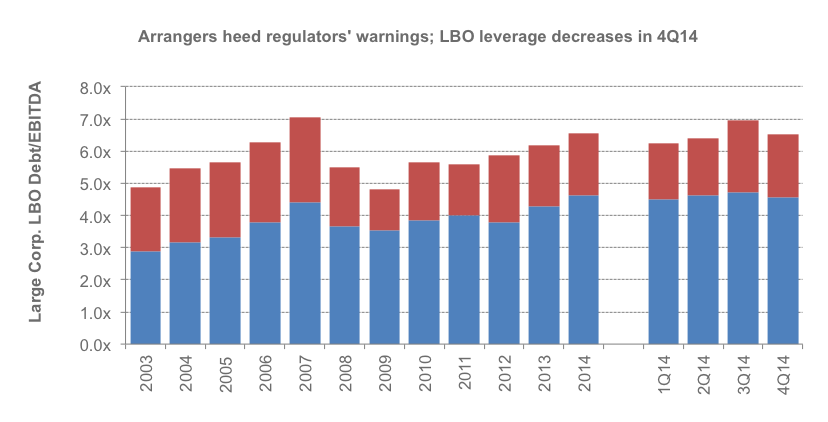 However, when using marketing EBITDA (includes cost savings synergies per the sponsor) of $378 million, leverage drops to 7 times and brings the average for the quarter down to 6.3 times, almost three quarters of a turn lower than last quarter. Furthermore, the proportion of deals levered greater than 7 times in 4Q14 has dwindled substantially from earlier this year. One third of large corporate LBO deals were levered over 7 times this quarter, down from 55% in 3Q14 and 42% in 2Q14. All eyes are on Petsmart given the $8.7 billion deal is structured with estimated leverage of 6.5 times. Market sources said several banks declined the potentially very lucrative mega deal due to concerns that the deal may not receive pass status by the regulators.
Contact: Fran Beyers
frances.beyers@thomsonreuters.com




Latest news

US leveraged loans returns turn negative in October
The Bloomberg US Leveraged Loan Index (Ticker: LOAN) has returned -0.26% this month through October 21, reducing its year-to-date return…

M&A activity begins to tick upward
In the third quarter of 2026, acquisition-linked loan volume across North America and Europe reached about $47 billion, up from $30.6 billion in Q2 and $29.5 billion a year ago.
