



As managers grapple with possible structures to work within the context of new finalized risk retention rules, the process of amending CLOs that are not Volcker compliant also continues. According to Thomson Reuters LPC Collateral, 58 percent of U.S CLOs have no bond or structured finance holdings compared to only 19 percent of European CLOs. 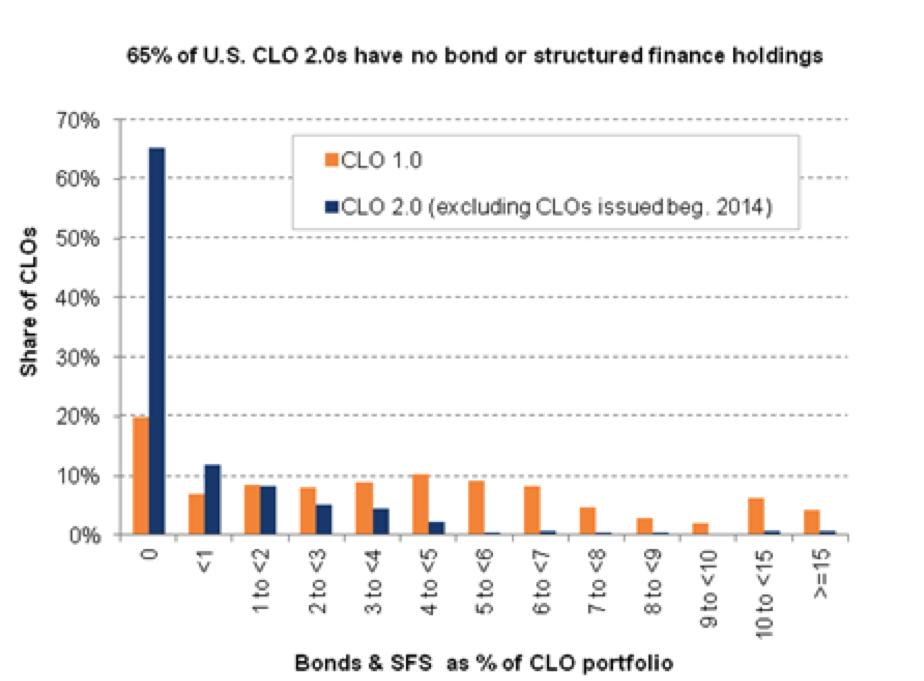 Even more relevant, U.S. CLO 2.0s (excluding CLOs issued beginning in 2014) hold much less in non-loan assets than 1.0s. In fact, 65 percent of CLO 2.0s have no bond or structured finance holdings versus only 20 percent of CLO 1.0s. How much are they holding? Fifty-five percent of European CLOs have one tenth or more of their portfolios invested in non-loan assets versus four percent of U.S. CLOs. In the U.S., 97 percent of CLO 2.0s hold less than five percent in non-loan assets. This figure falls to 62 percent for CLO 1.0s. Given that the July 2015 deadline will make it difficult for banks to own notes of non-compliant CLOs, as of now, roughly eighty percent of the $142 billion in 2011-2013 vintage CLOs will still be impacted.
Contact:
Colm Doherty
Colm.doherty@thomsonreuters.
Ioana Barza
ioana.barza@thomsonreuters.com




Latest news

US leveraged loans returns turn negative in October
The Bloomberg US Leveraged Loan Index (Ticker: LOAN) has returned -0.26% this month through October 21, reducing its year-to-date return…

M&A activity begins to tick upward
In the third quarter of 2026, acquisition-linked loan volume across North America and Europe reached about $47 billion, up from $30.6 billion in Q2 and $29.5 billion a year ago.
