



Loan mutual fund & ETF assets under management edged higher to just over $139 billion in May as these funds registered a second consecutive month of inflows as expectations around higher interest rates once again came to the fore. Despite the combined inflows of $646 million in April and May, this still left loan funds AUM down 1.5 percent year to date and off 20 percent from their high of $174 billion recorded in March of last year. 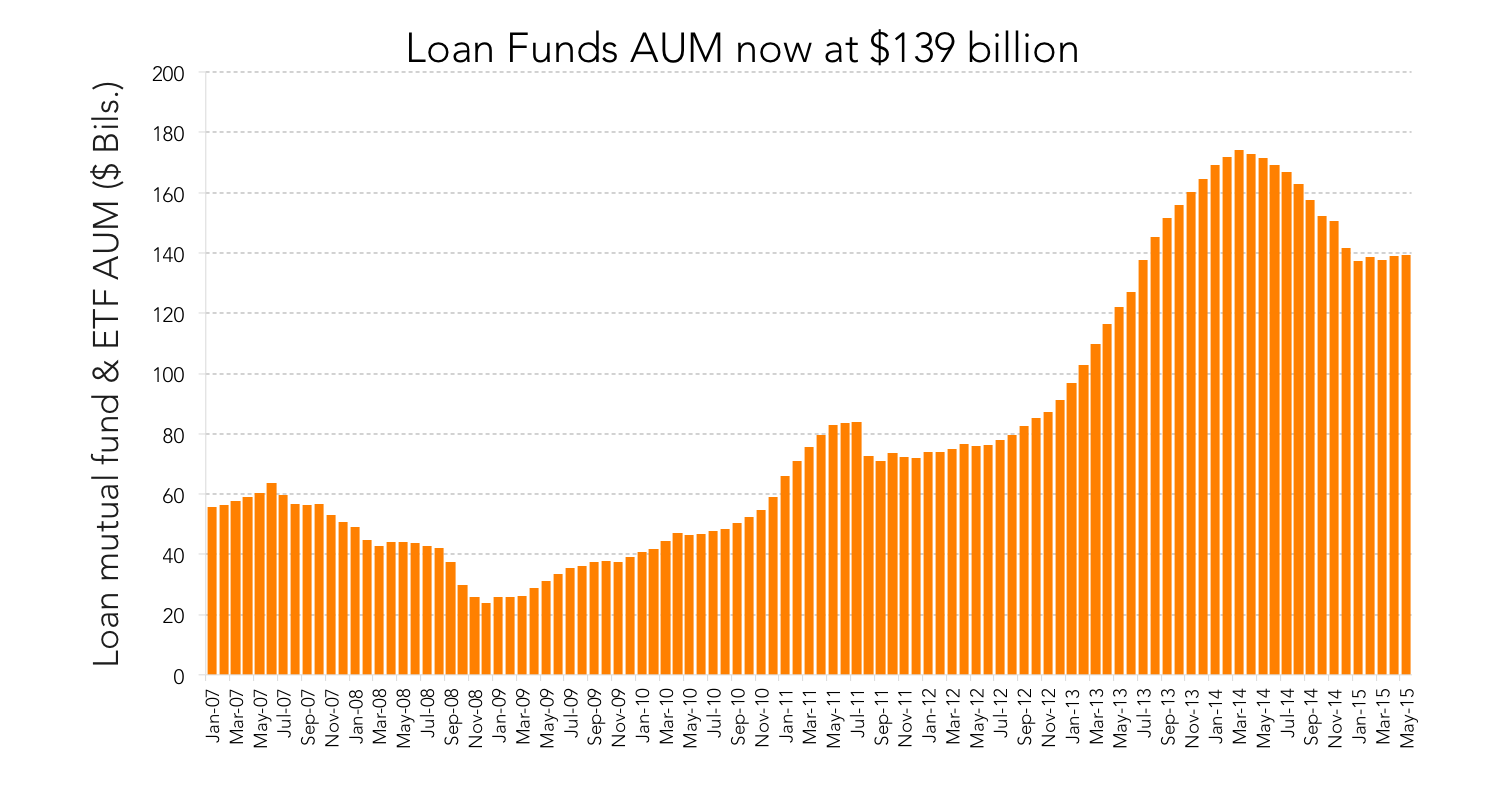 Loan funds now hold roughly 15 percent of institutional loans in the market, down from 23 percent in early 2014. CLOs on the other hand have seen their share of the institutional market increase to 48 percent following a strong start to the year in terms of issuance. More recenly, the trend of inflows into loan funds has proved to be short-lived with loan fund flows turning negative again in early June, with two straight weeks of outflows totaling $317 million.
Contact: Colm Doherty
colm.doherty@thomsonreuters.com




Latest news

US leveraged loans returns turn negative in October
The Bloomberg US Leveraged Loan Index (Ticker: LOAN) has returned -0.26% this month through October 21, reducing its year-to-date return…

M&A activity begins to tick upward
In the third quarter of 2026, acquisition-linked loan volume across North America and Europe reached about $47 billion, up from $30.6 billion in Q2 and $29.5 billion a year ago.
