



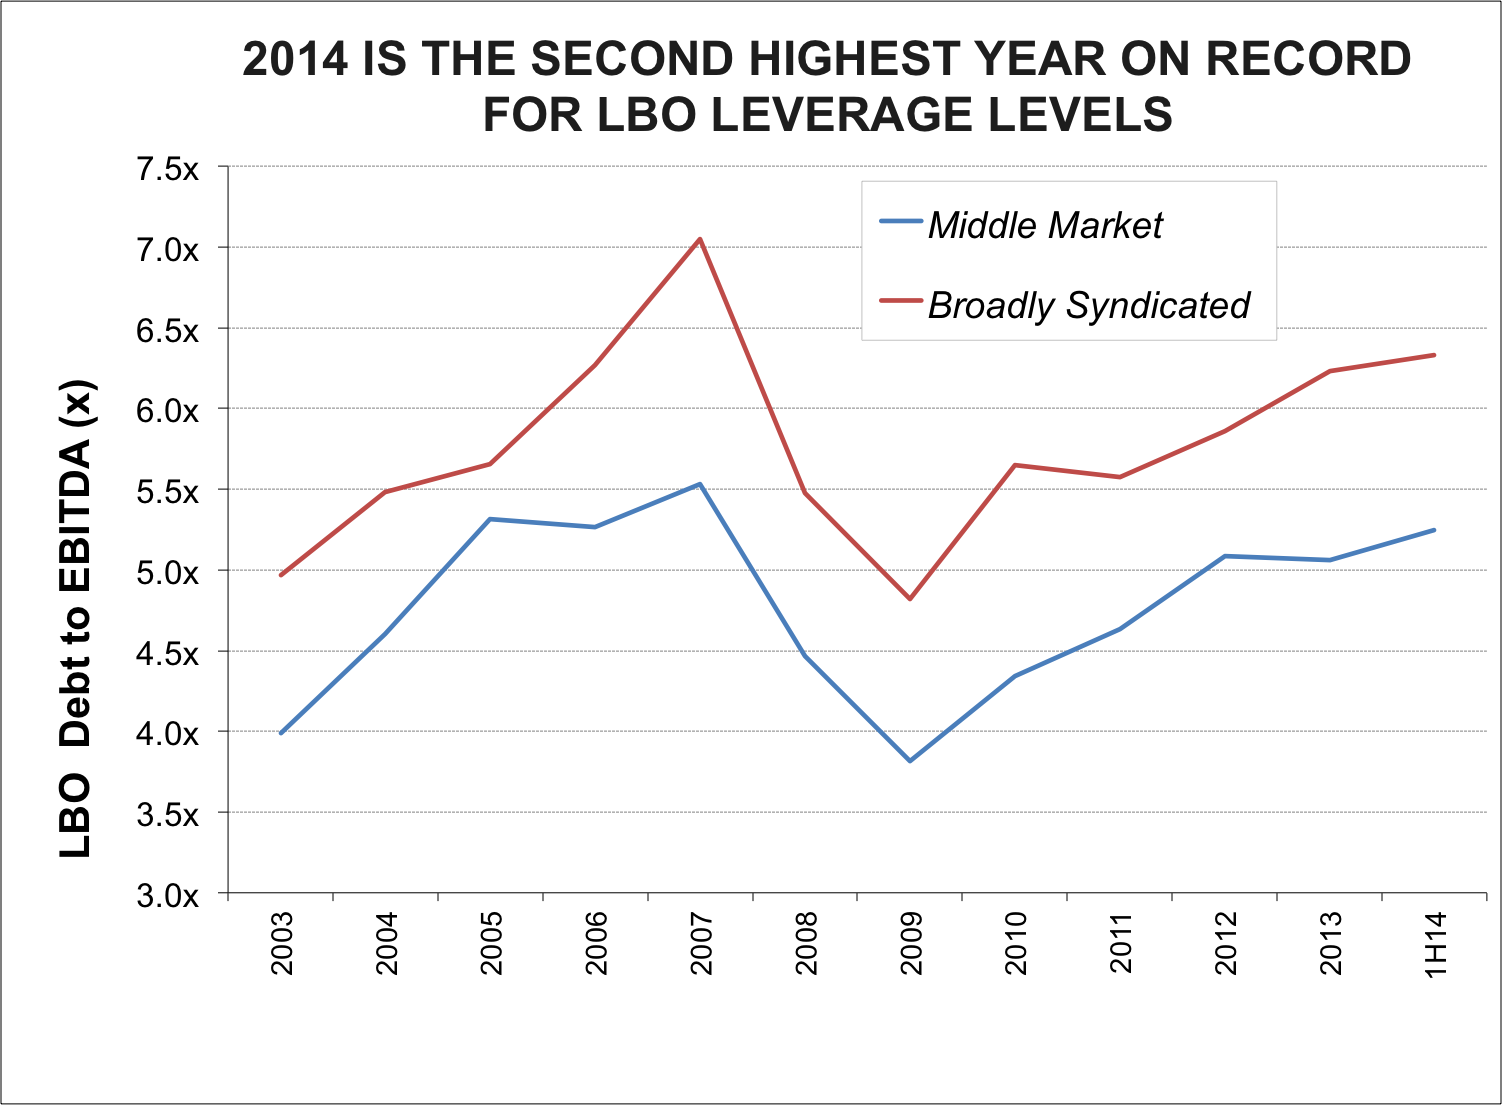
LBO volume is strong in 2014, already reaching $47 billion in 1H14 with a significant amount of deal volume in the pipeline. As private equity backed buyout activity accelerates, leverage levels have too. In 1H14, the average debt to EBITDA for large corporate LBO deals spiked to 6.33 times, up from 6.23 times in 2013 and 5.86 times in 2012. In fact, 2014 is the second highest year on record for LBO leverage levels, behind the 7.05 times seen in 2007. Many deals exhibited leverage greater than 7 times including Wencor, Electronic Funds Source, Phillips-Medisize, Skillsoft, IMG Worldwide, and Checkout Holdings to name a few. In the institutional middle market, leverage also crept up in 1H14 to 5.25 times, up from 5.1 times in 2013 and 2012. However, dealflow has been rather limited compared to the large corporate market. Several very aggressively levered deals really dragged the average up including ABILITY Network, Genex, Institutional Shareholder and Pregis Corp. Lofty purchase price multiples and availability of capital among both lenders and sponsors continue to set the stage for rising leverage levels.
What were you doing in 1995? Join us for our 20th Annual Loan Conference on Sept. 18th





Latest news

Rate hike expectations ease as term SOFR curve flattens
The CME six-month Term SOFR rate reached a recent high of 3.979% on July 28 before retreating to 3.837% as…
3Q26: New loan assets rise to 44% of total lending, a 3-year high
New loan assets as a proportion of total US loan volume make up 44% of the 3Q26 pipeline to date,…

North American GPs dominant as fundraising accelerates
Our PEI Private Credit 200 ranking also shows capital raising increasing overall – and accelerating especially fast for the largest…