



Click here to learn more.
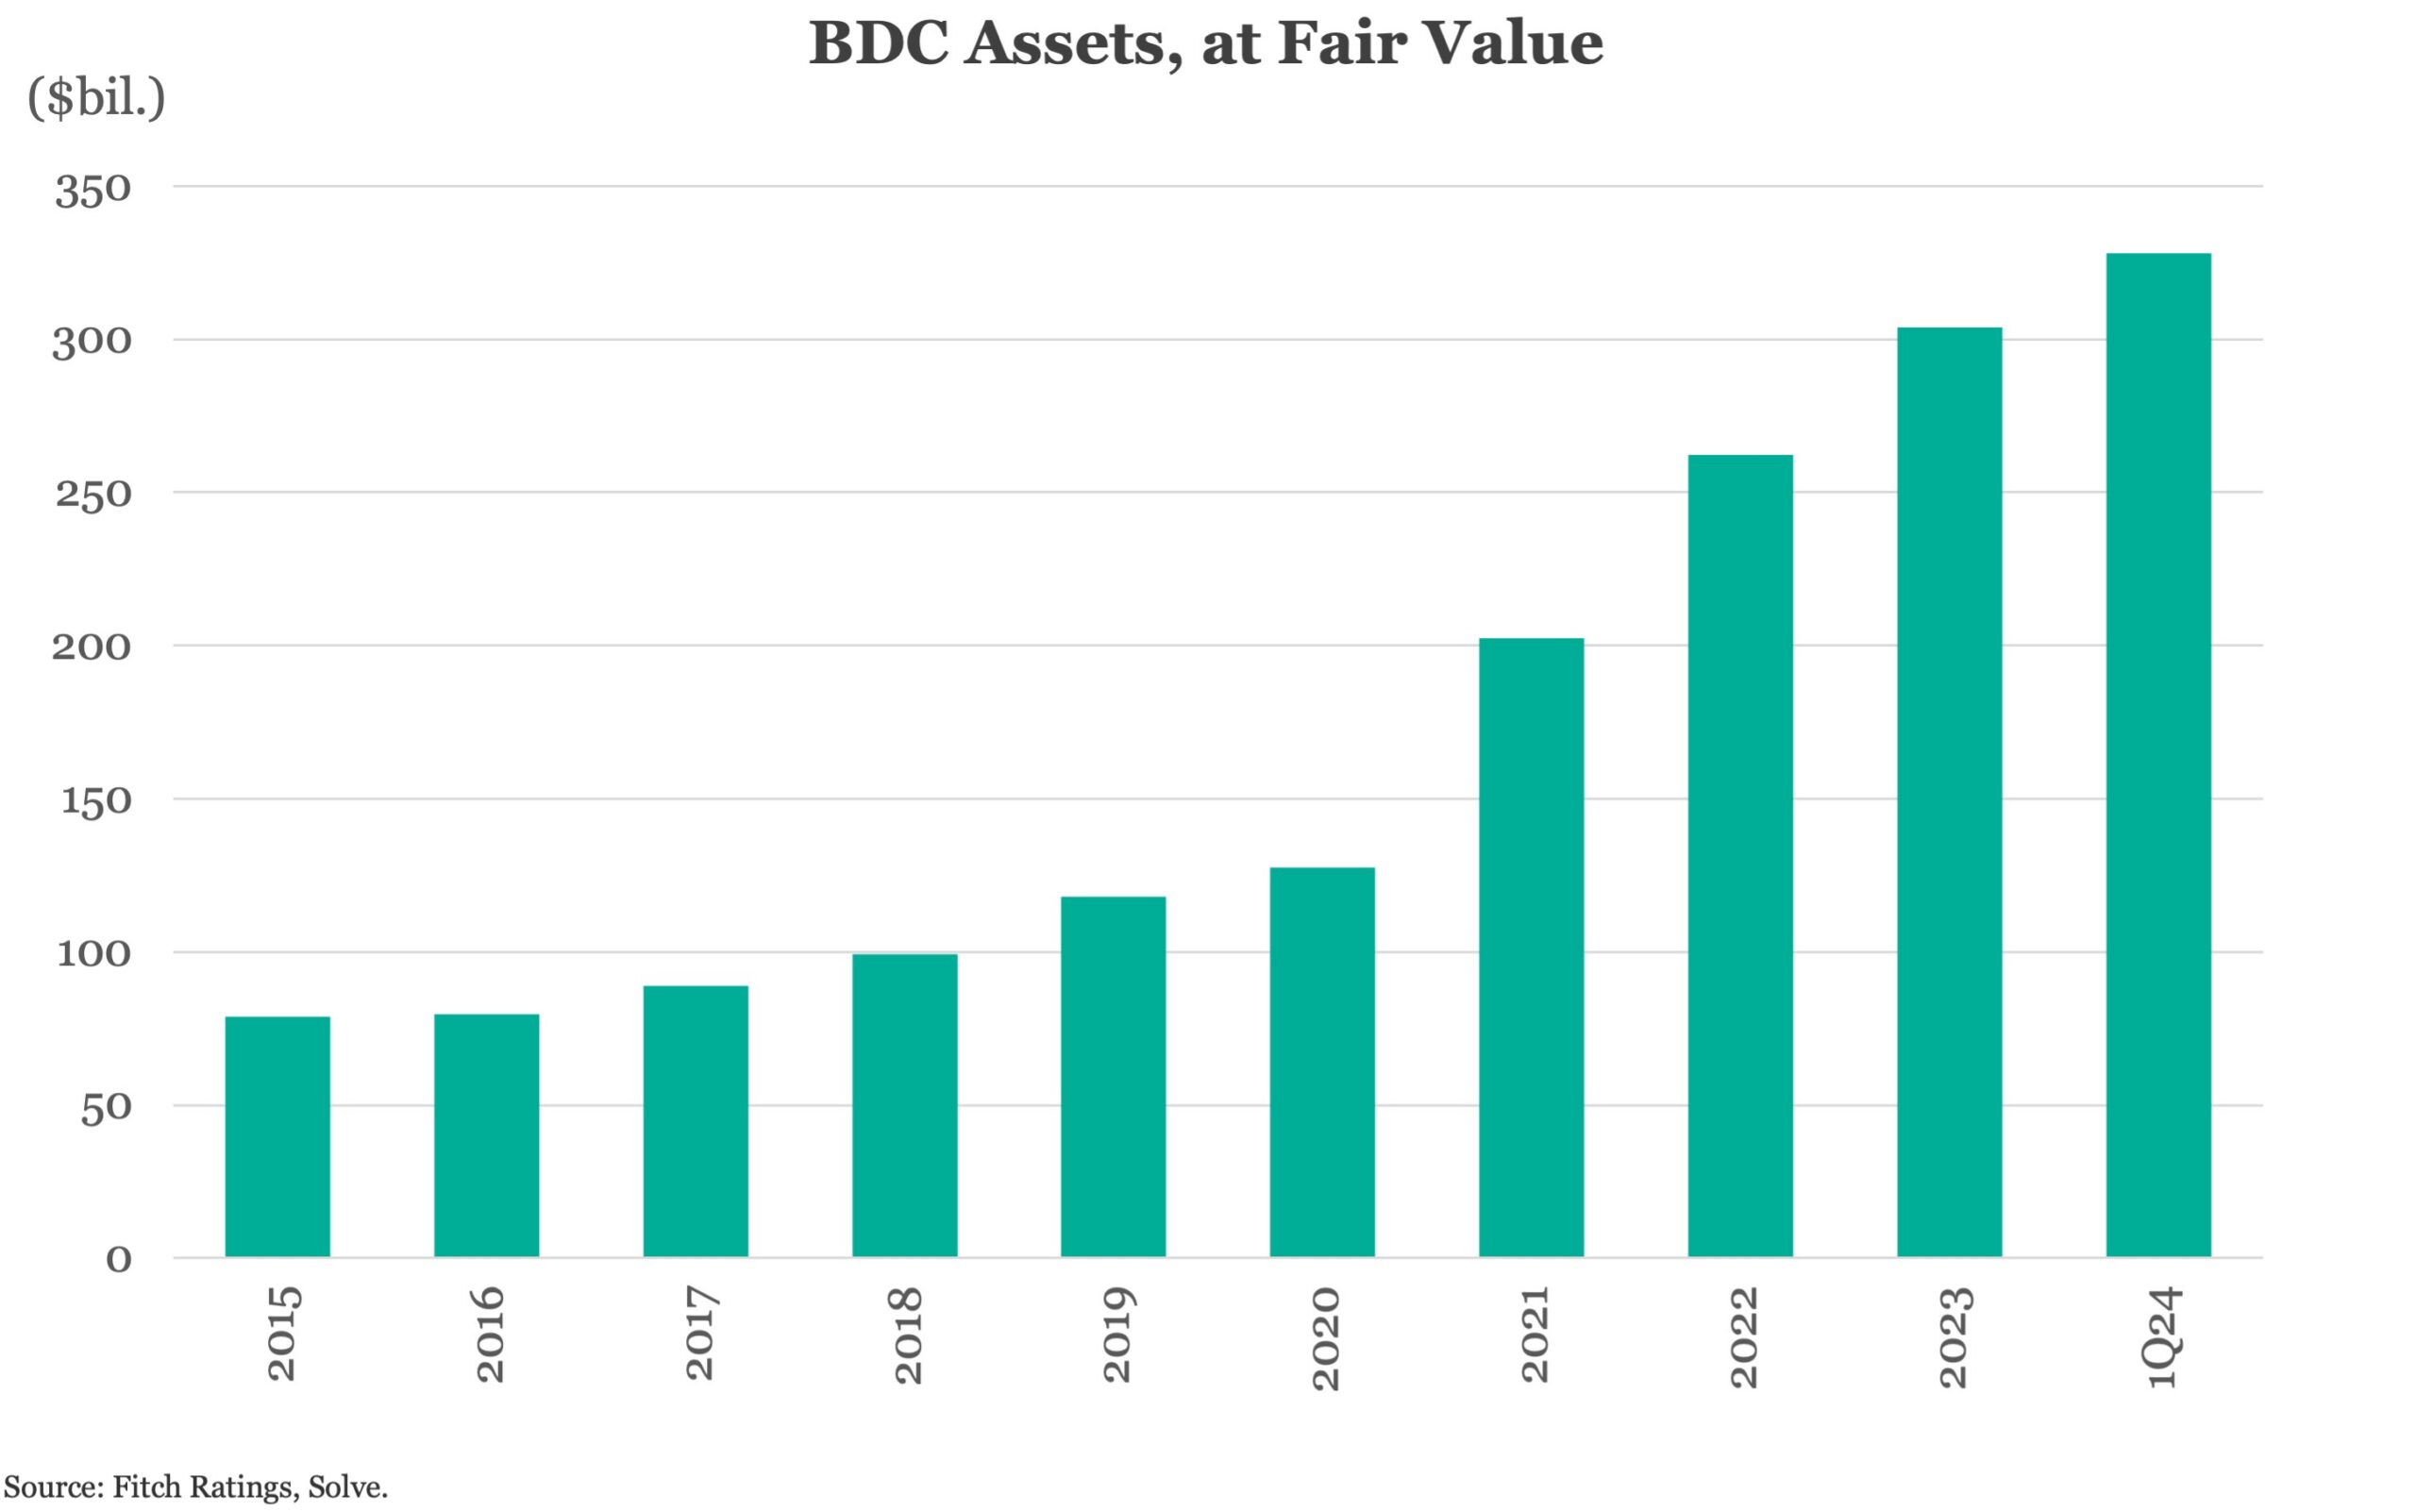
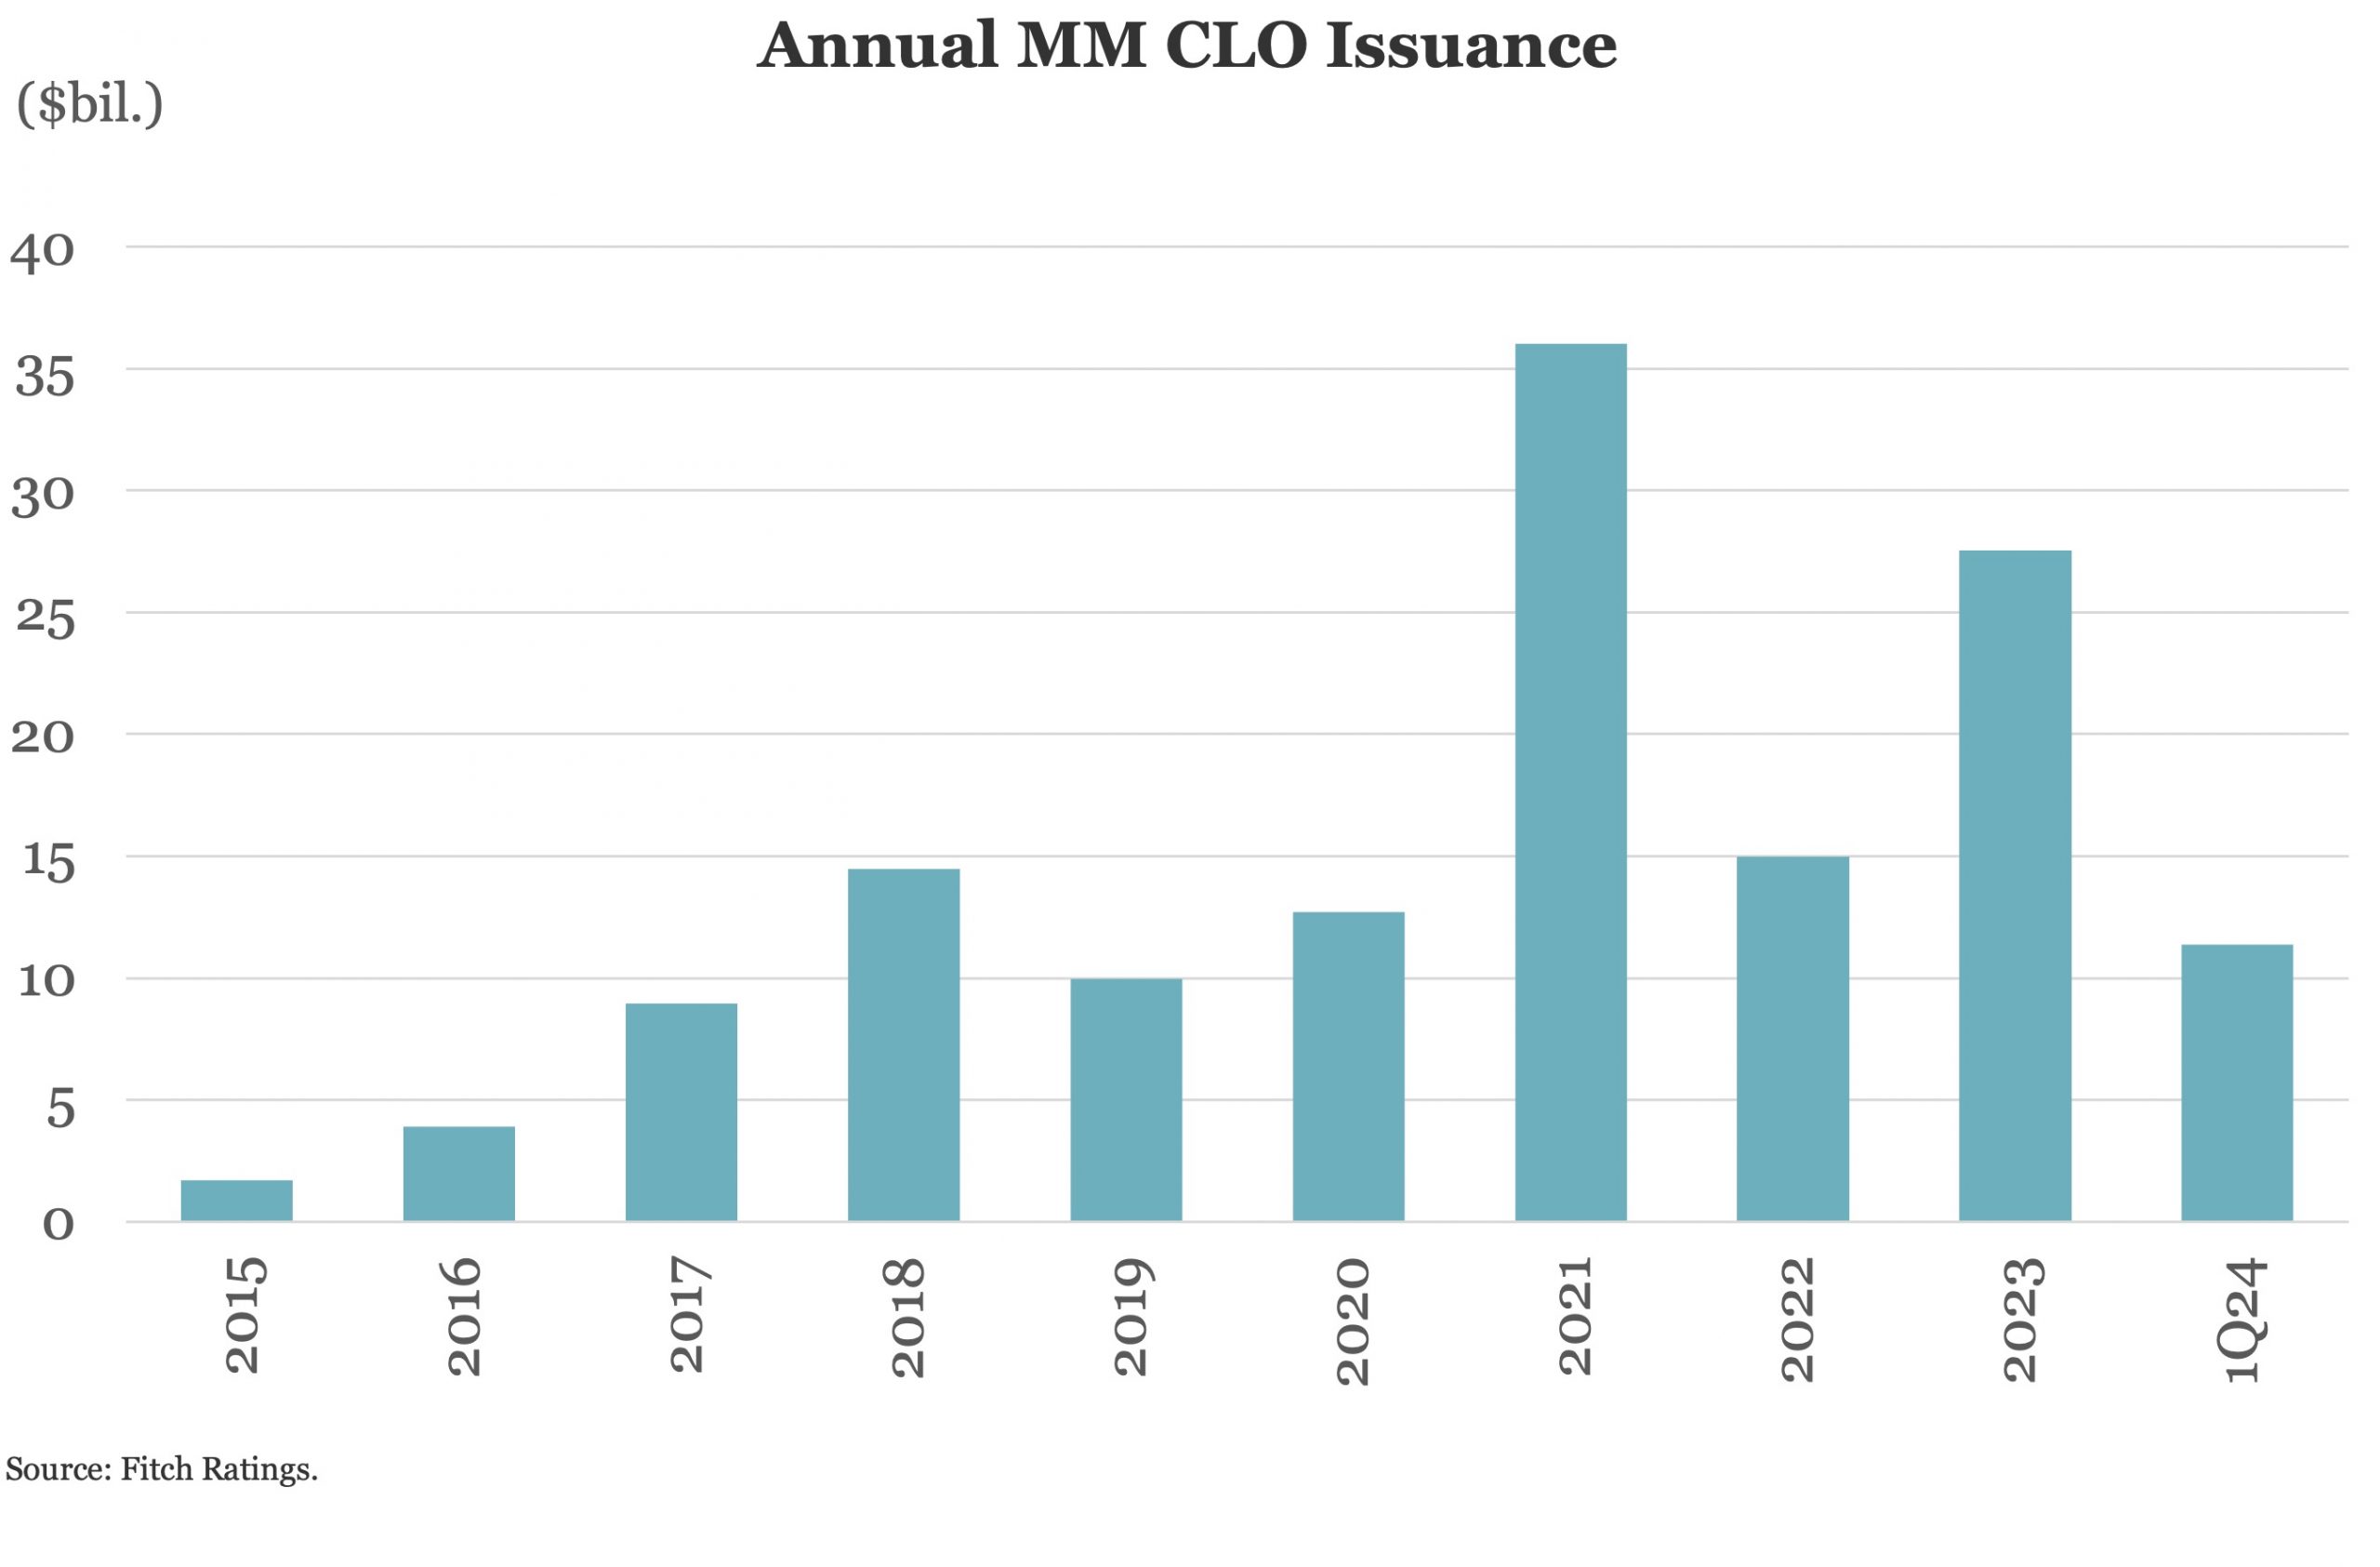
While the expansion in private credit has attracted widespread media attention in recent years, direct lending has been around for several decades and remains the largest segment of private credit. Two of the most prominent financing vehicles in direct lending are business development companies (BDCs) and middle market collateralized loan obligations (MM CLOs). Fitch has been rating BDCs since 2005 and currently rates 26 BDCs publicly. Fitch has been rating MM CLOs since 2002 and currently rates 56 transactions. Both of these vehicles primarily invest in middle market loans (generally defined as companies with EBITDA of $75 million or less), but senior tranches of MM CLOs can obtain ratings as high as ‘AAAsf’, while BDC ratings are firmly centered in the ‘BBB’ category.
This report highlights the differences in asset composition, liability risks, and structural features that explain this rating differential. In short, stricter and more conservative collateral eligibility requirements, cash diversion features, which allow for priority repayment of higher rated tranches, the lack of liability refinancing risk and the lack of sensitivity to changes in asset valuations are all positive rating differentiators of MM CLO structures relative to BDCs. BDCs benefit from increased investment and operational flexibility, albeit at the cost of lower credit ratings.




Latest news

US leveraged loans returns turn negative in October
The Bloomberg US Leveraged Loan Index (Ticker: LOAN) has returned -0.26% this month through October 21, reducing its year-to-date return…

M&A activity begins to tick upward
In the third quarter of 2026, acquisition-linked loan volume across North America and Europe reached about $47 billion, up from $30.6 billion in Q2 and $29.5 billion a year ago.
