Corrections strongest in growth, VC strategies

PB icon
Content hub / Article / PitchBook / Corrections strongest in growth, VC strategies


Download PitchBook’s Report here.

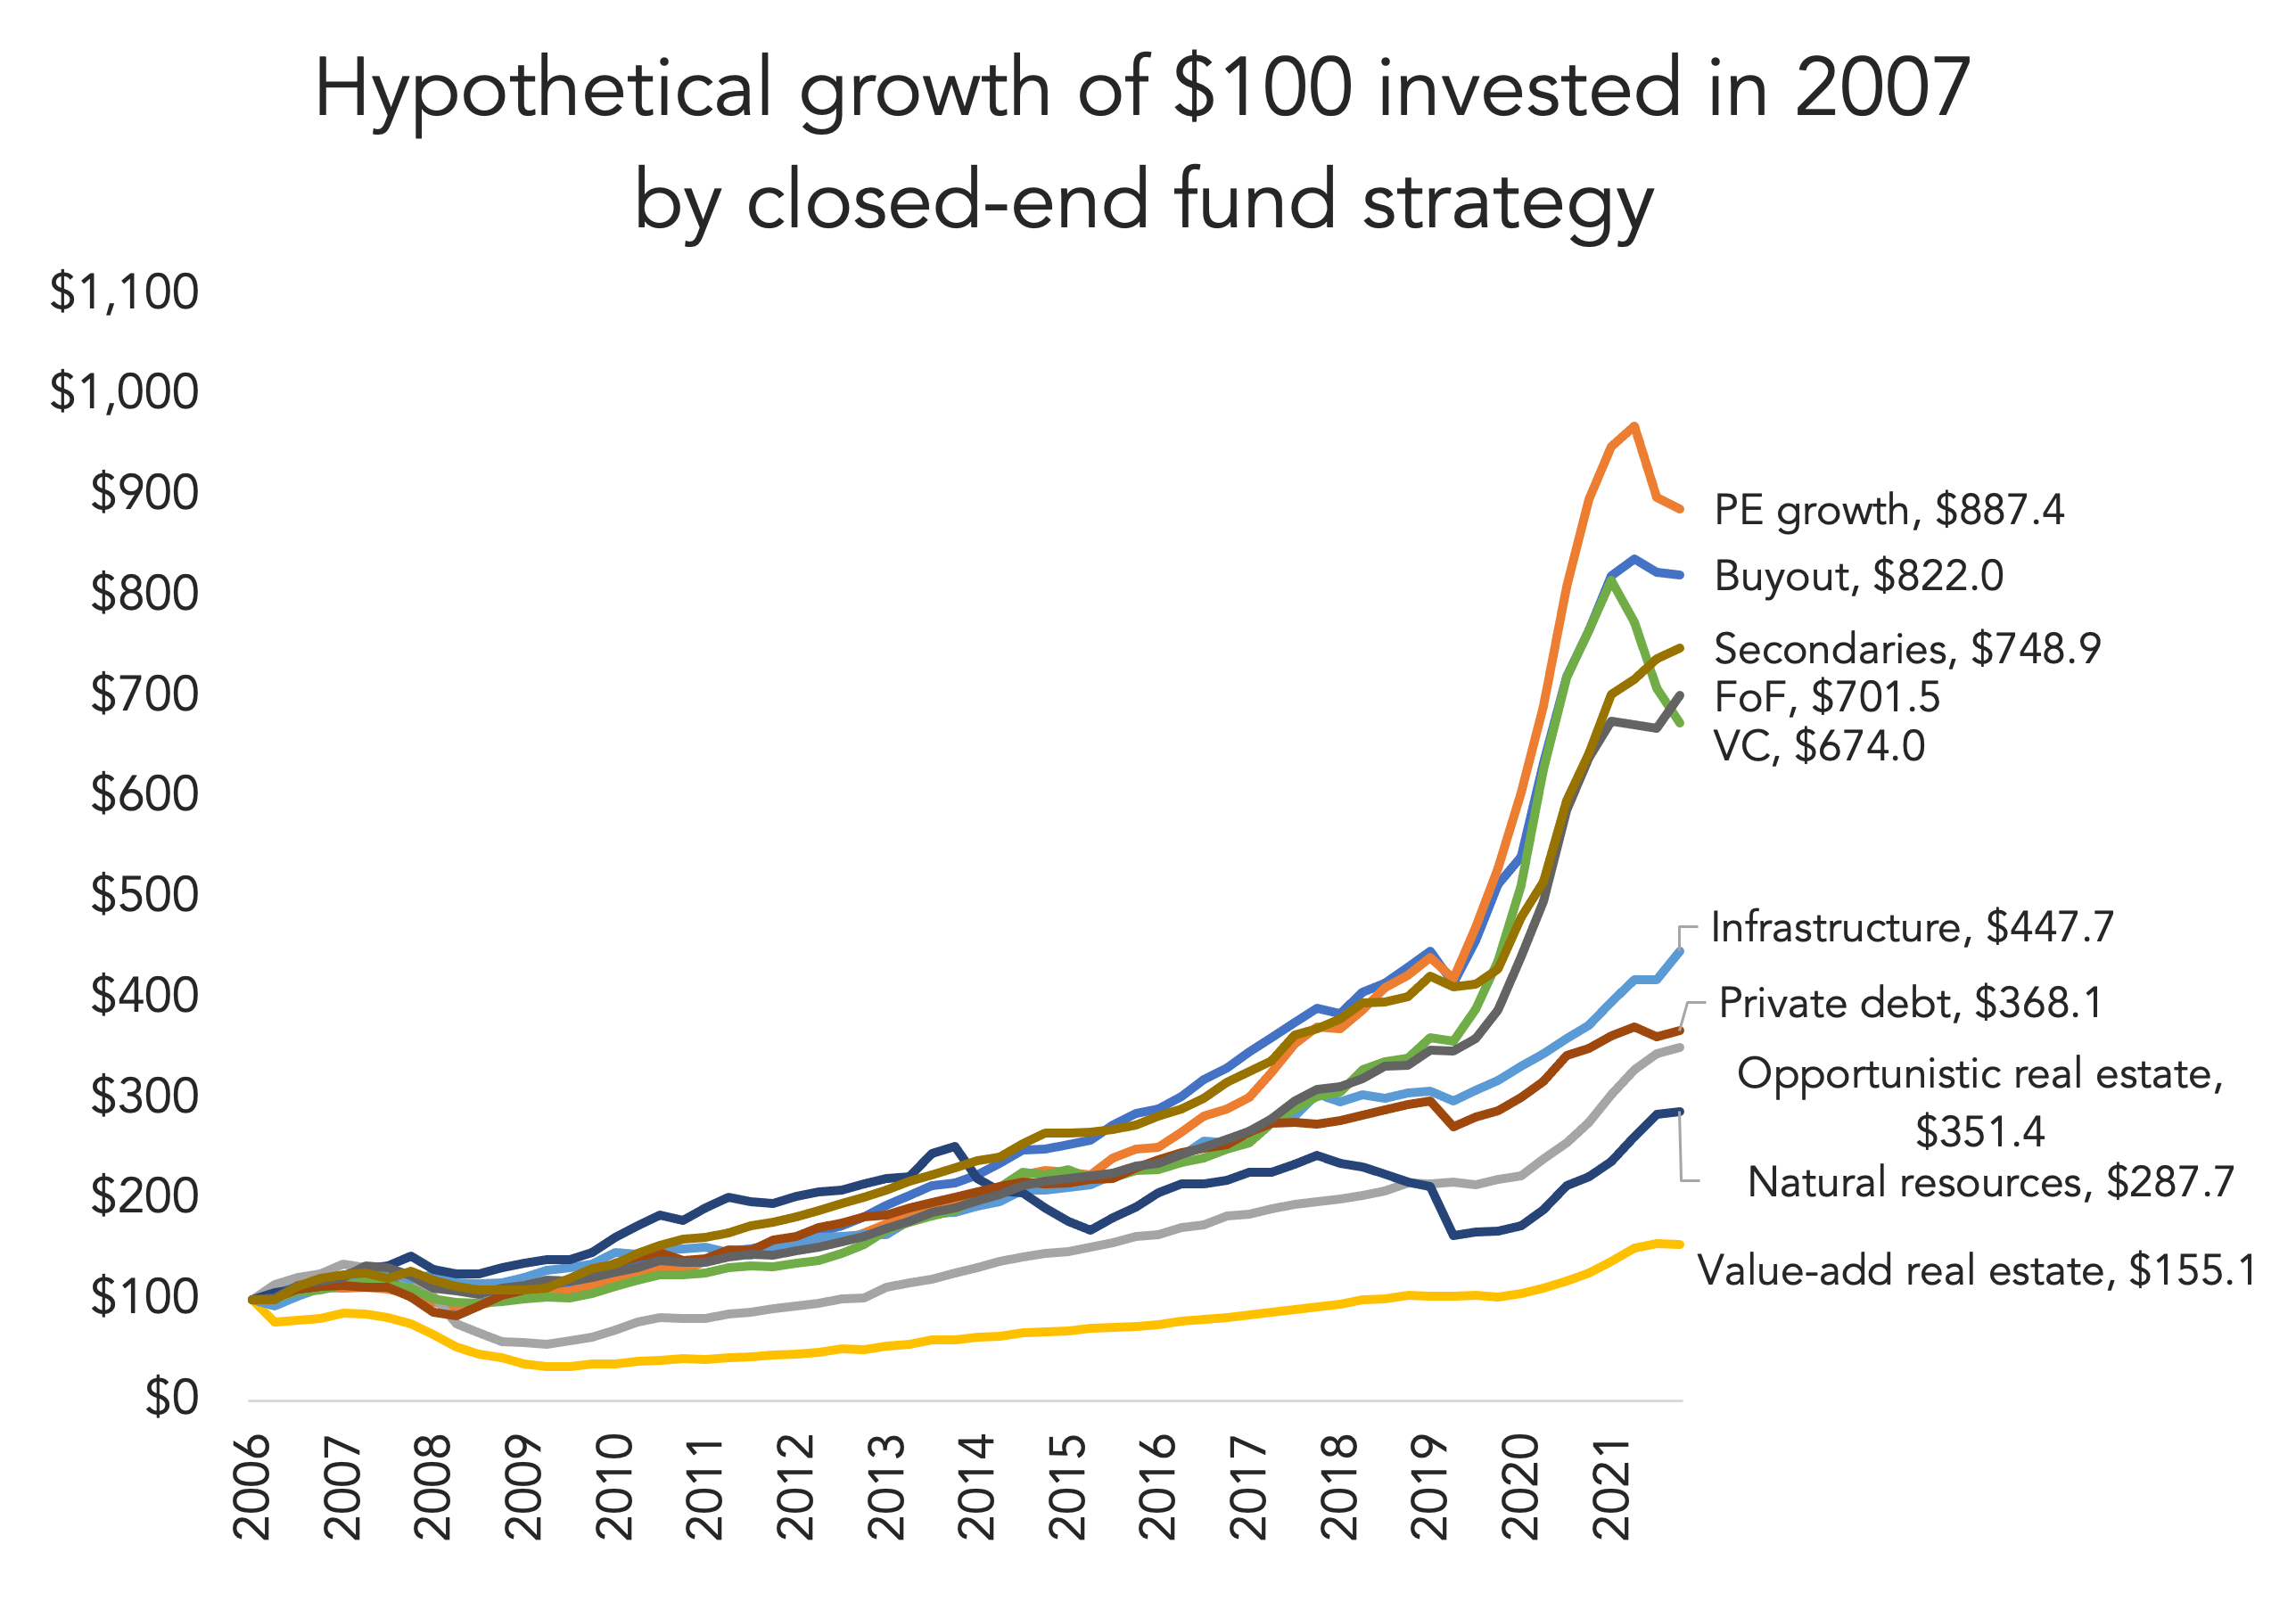
PitchBook’s latest Quantitative Perspectives Report, available for free here, found a strong run-up in five strategies since 2019. The strongest surge was among PE growth funds, where hypothetical growth more than doubled between Q1 2020 and Q4 2021. $100 invested in 2007 would have equated to roughly $420 by the COVID outbreak. From there, though, the same $100 would have ballooned to almost $970 by the end of 2021. While PE growth’s increase was one of the sharpest among closed-end strategies, so was its correction. By September 2022, its hypothetical value declined to $887, a 9% dip in the span of three quarters. The only other asset class to experience the same roller coaster was venture, though it never reached the heights of the PE growth market. After topping out at $817 in Q4 2022, the same $100 investment fell to $674 by Q3 2022, a 17% decline.

Our analysis found resiliency among other asset classes. Buyout strategies haven’t lost much ground, and secondaries, FoF and Infrastructure strategies continue to climb.

The report, with more than 70 more pages of additional data and context, includes NAV and AUM growth forecasts, unicorn birth rates and exit statistics across multiple asset classes.

(Past performance is no guarantee of future results.)

Contact Alex Lykken
Business development companies and the rise of balance sheet financing vehicles

Podcast

Business development companies and the rise of balance sheet financing vehicles

Fitch's Deb Murnin and Chelsea Richardson discuss the growing use of off-balance-sheet JVs and finance companies among BDCs, exploring the drivers, leverage impacts, portfolio risk profiles, and potential rating implications for Fitch-rated BDCs.
Listen
Private Debt Investor New York Forum

September 15-16, Hudson Yards, New York

Private Debt Investor New York Forum

Bringing together the investors, managers and advisers shaping the next phase of the market — 200+ allocators and $10.6 trillion of LP capital expected. Benchmark strategies, hear from leading LPs, and cut through market noise over two unmissable days.
Learn more
US Private Credit League Tables H1'26

Report

US Private Credit League Tables H1'26

The definitive rankings covering private credit activity in H1'26.
Download
PitchBook's Q2 2026 US PE Breakdown

Report

PitchBook's Q2 2026 US PE Breakdown

Software freezes and energy powers on as US PE deal value falls 38% in Q2 2026.
Download
Making sense of private credit defaults

Webinar

Making sense of private credit defaults

What does private credit default data really tell us? Join our exclusive webinar featuring experts from KBRA, Moody's, Fitch Ratings, and S&P Global to find out.
Register

Latest news

    Rate Hike Expectations Regain Steam following Jackson Hole

    The CME six-month Term SOFR rate reached a recent high of 3.979% on July 28 before retreating to 3.821% as…

    Read More

    Private Credit Defaults 101: Back to School

    As Labor Day approaches, the unofficial end of summer is upon us. But, before we get too sad, there is also the familiar back-to-school energy.

    Read More

    Grading on a Curve

    Grades depend on how the questions get answered.

    Read More