



Download PitchBook’s Report here.
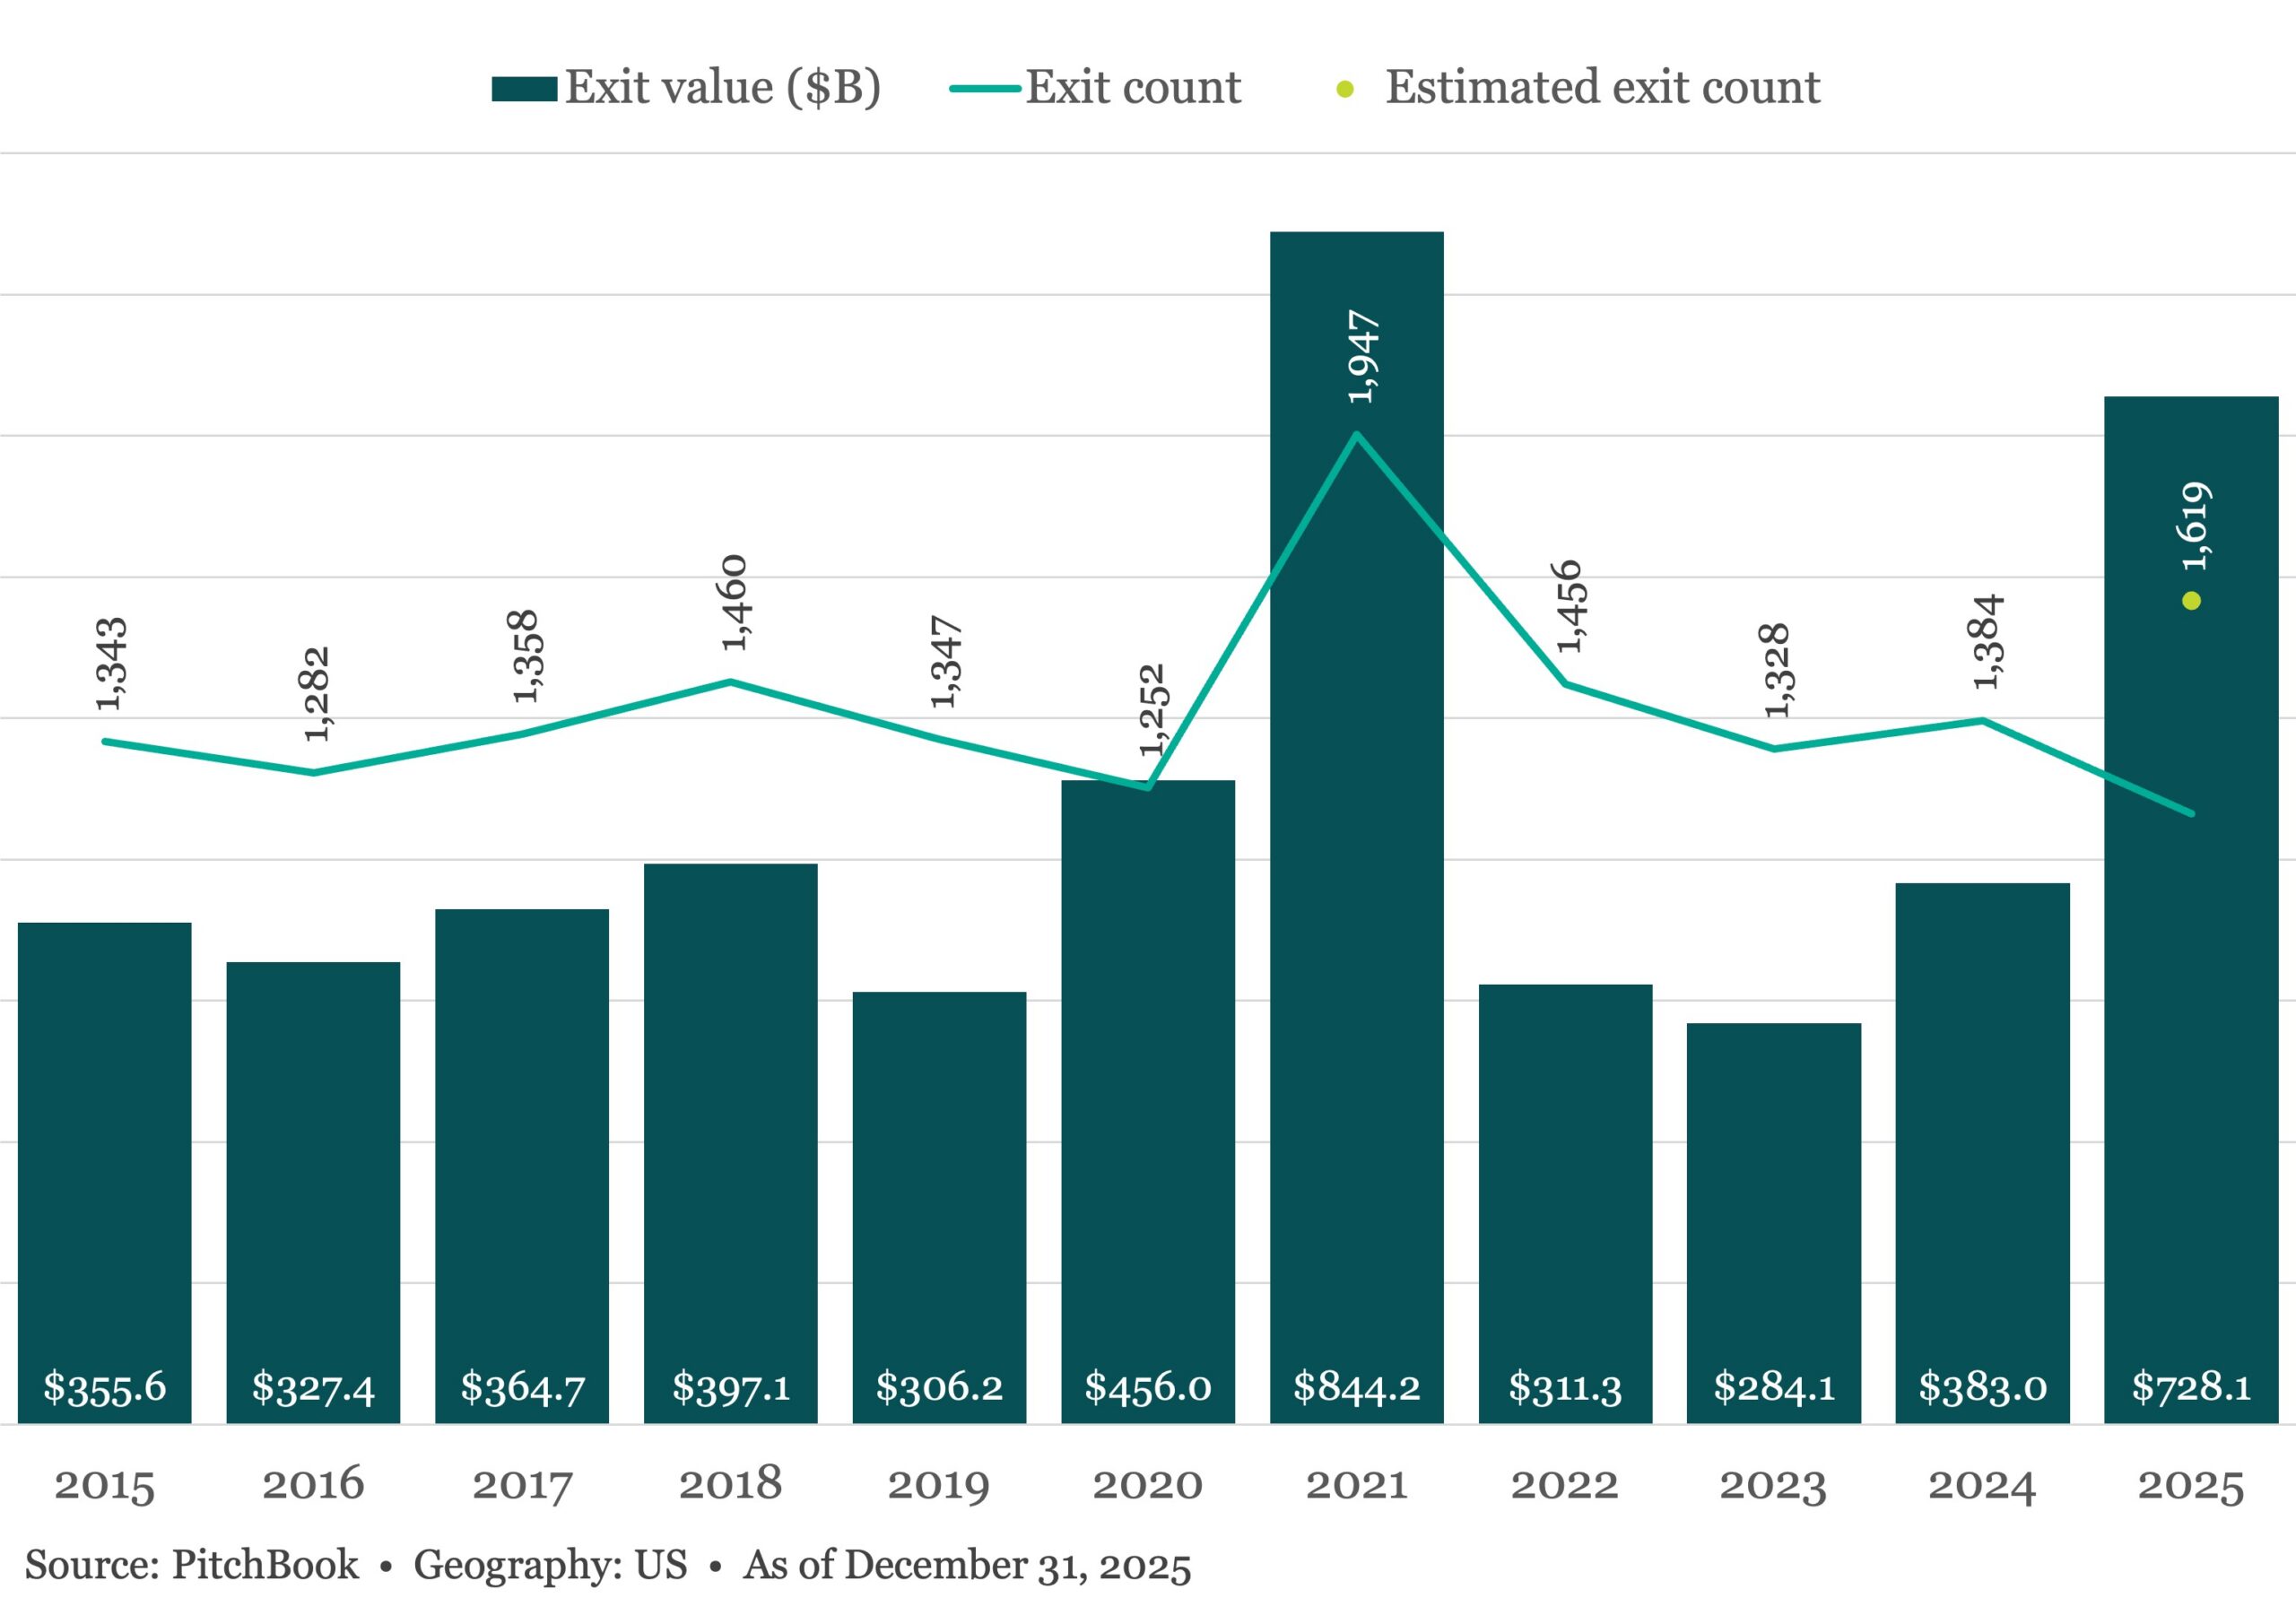
US PE exit activity is now clearly out of the woods, securing not only a second consecutive year of growth in 2025 but also a rebound that ranks second only to the record levels seen in 2021. With an estimated 1,619 exits for an aggregate of $728.1 billion, exits have improved by a whopping 90.1% in value and 17% by count. Despite quarterly volatility driven by macroeconomic uncertainty and emerging geopolitical risks, exit value rebounded in Q4 following a recent dip. This recovery, combined with the strong performance in the first half of the year, pushed full-year exit activity above 2024 levels in both value and deal count. In Q4, there were approximately 429 exits for an aggregate of $229.2 billion, which was a QoQ decline of 7.7% in exit count and growth of 98.5% in exit value. The jump in exit value is impressive, driven by a handful of outsized exits, resulting in the highest quarterly exit value since Q2 2021. What is also notable about the second half of the year is the growth in exit count: The higher number of exits in Q3 and Q4 2025 was more similar to the quarterly average seen in 2021, driving double-digit YoY growth in exit count for the first time in the past four years
(Past performance is no guarantee of future results.)


Latest news

US leveraged loan launches reach five-month high in September
The US leveraged loan market recorded $93.6b of launches in September, marking the busiest month of primary market activity since…

Information technology topped nonaccruals on a cost basis
The information technology sector moved from second place in the first quarter to the top of the list in the second quarter
