



Download PitchBook’s Report here.
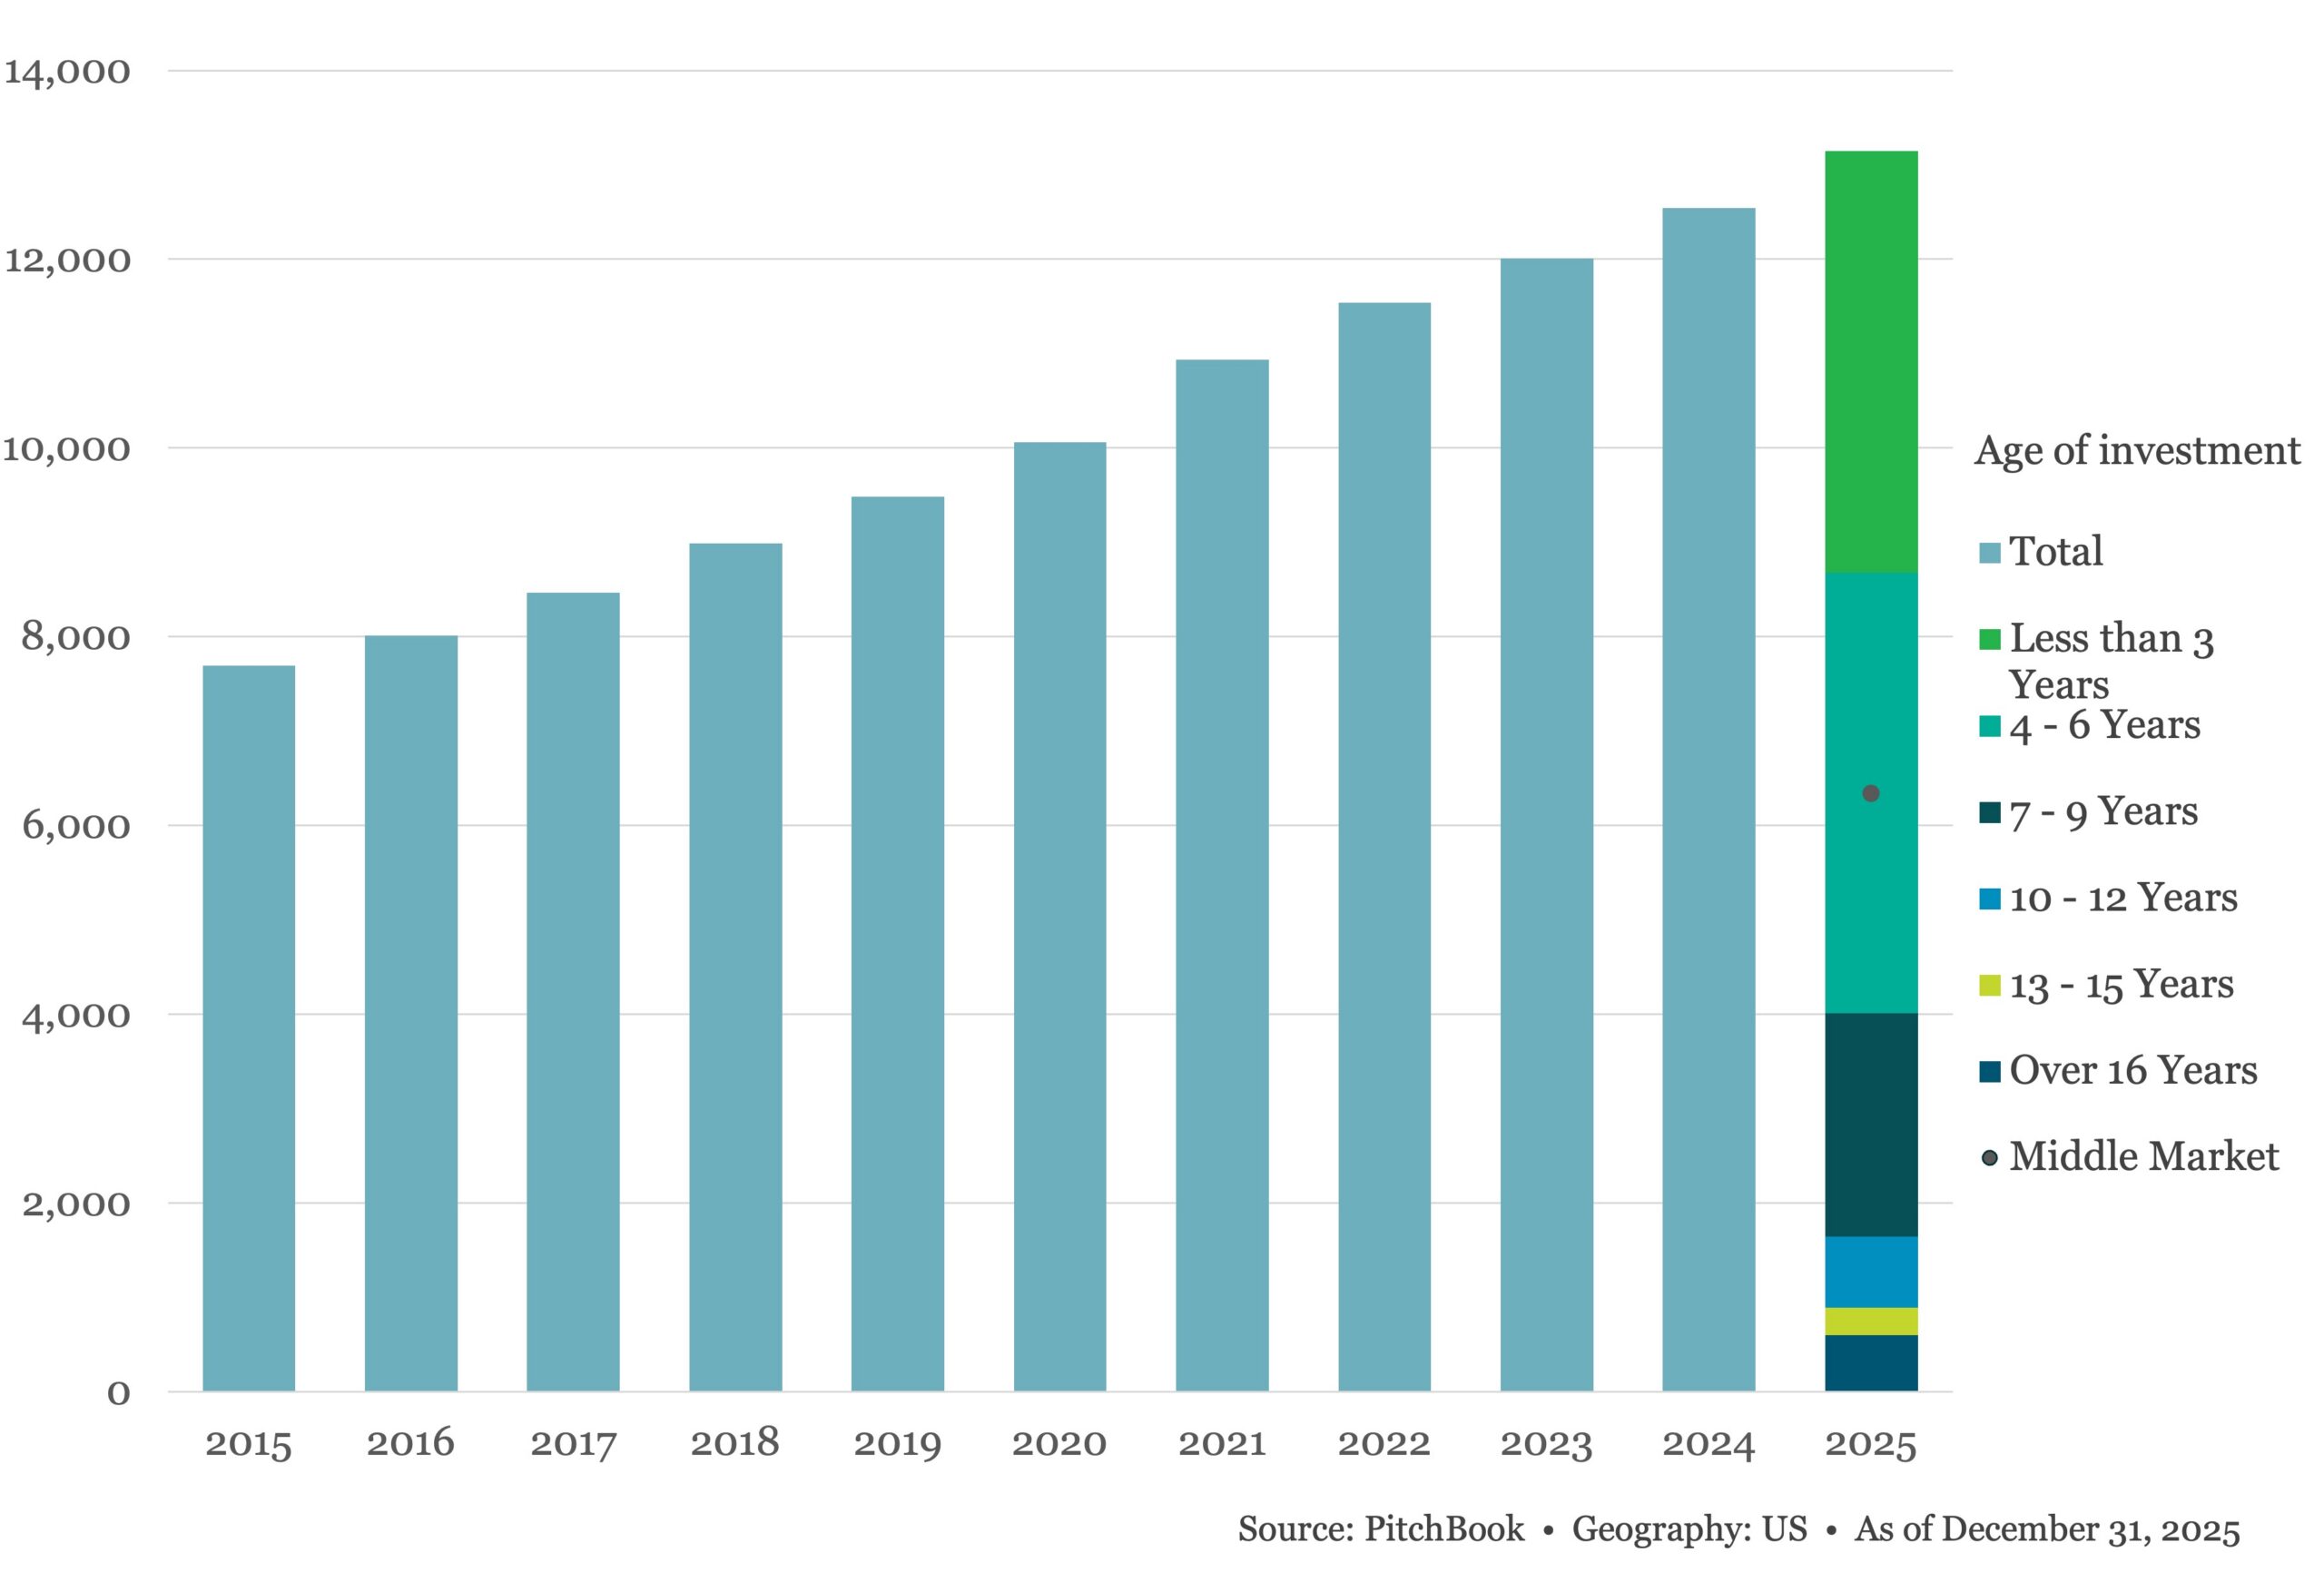
As of Q4 2025, the US PE inventory has grown to over 13,143 companies. At the pace of exits seen in 2025, this translates to over an 8.1-year inventory, which is a faster cycling of PE assets than when calculated with the annualized H1 2025 exit pace. The median hold times for US PE-backed companies also continued to trend downward from its 2023 peak when it recorded a seven-year median. By the end of 2025, it has fallen to a median hold of six years, which is a welcome improvement but still above the 5.5 pre-pandemic average. As for PE assets still being held by GPs, the median hold time has climbed to a record of 4 years. This reflects the aging inventory of PEbacked assets, as exit activity has stalled over the past three years. While large companies have been successful in securing impressive exit sizes, it remains to be seen if the rest of the PE-backed assets will be able to exit as quickly.
(Past performance is no guarantee of future results.)



Latest news

PIK Your Next Adventure
Every amended PIK loan hits the same crossroad. Not everyone ends up at the same destination.

Top 50 BDCs Accounted for 75% of Nonaccrual Loan Cost in Q2’26
The 50 largest BDCs, on the basis of total debt investments as of the second quarter of 2026, accounted for 75% of the total aggregate reported value of nonaccrual debt at cost and fair value.
Private Credit Defaults 101: Beyond the Noise
Like any good school year, this series went by fast. As class comes to an end, there’s one theme that’s been top of mind here at The Lead: “noise.”