



Download PitchBook’s Report here.
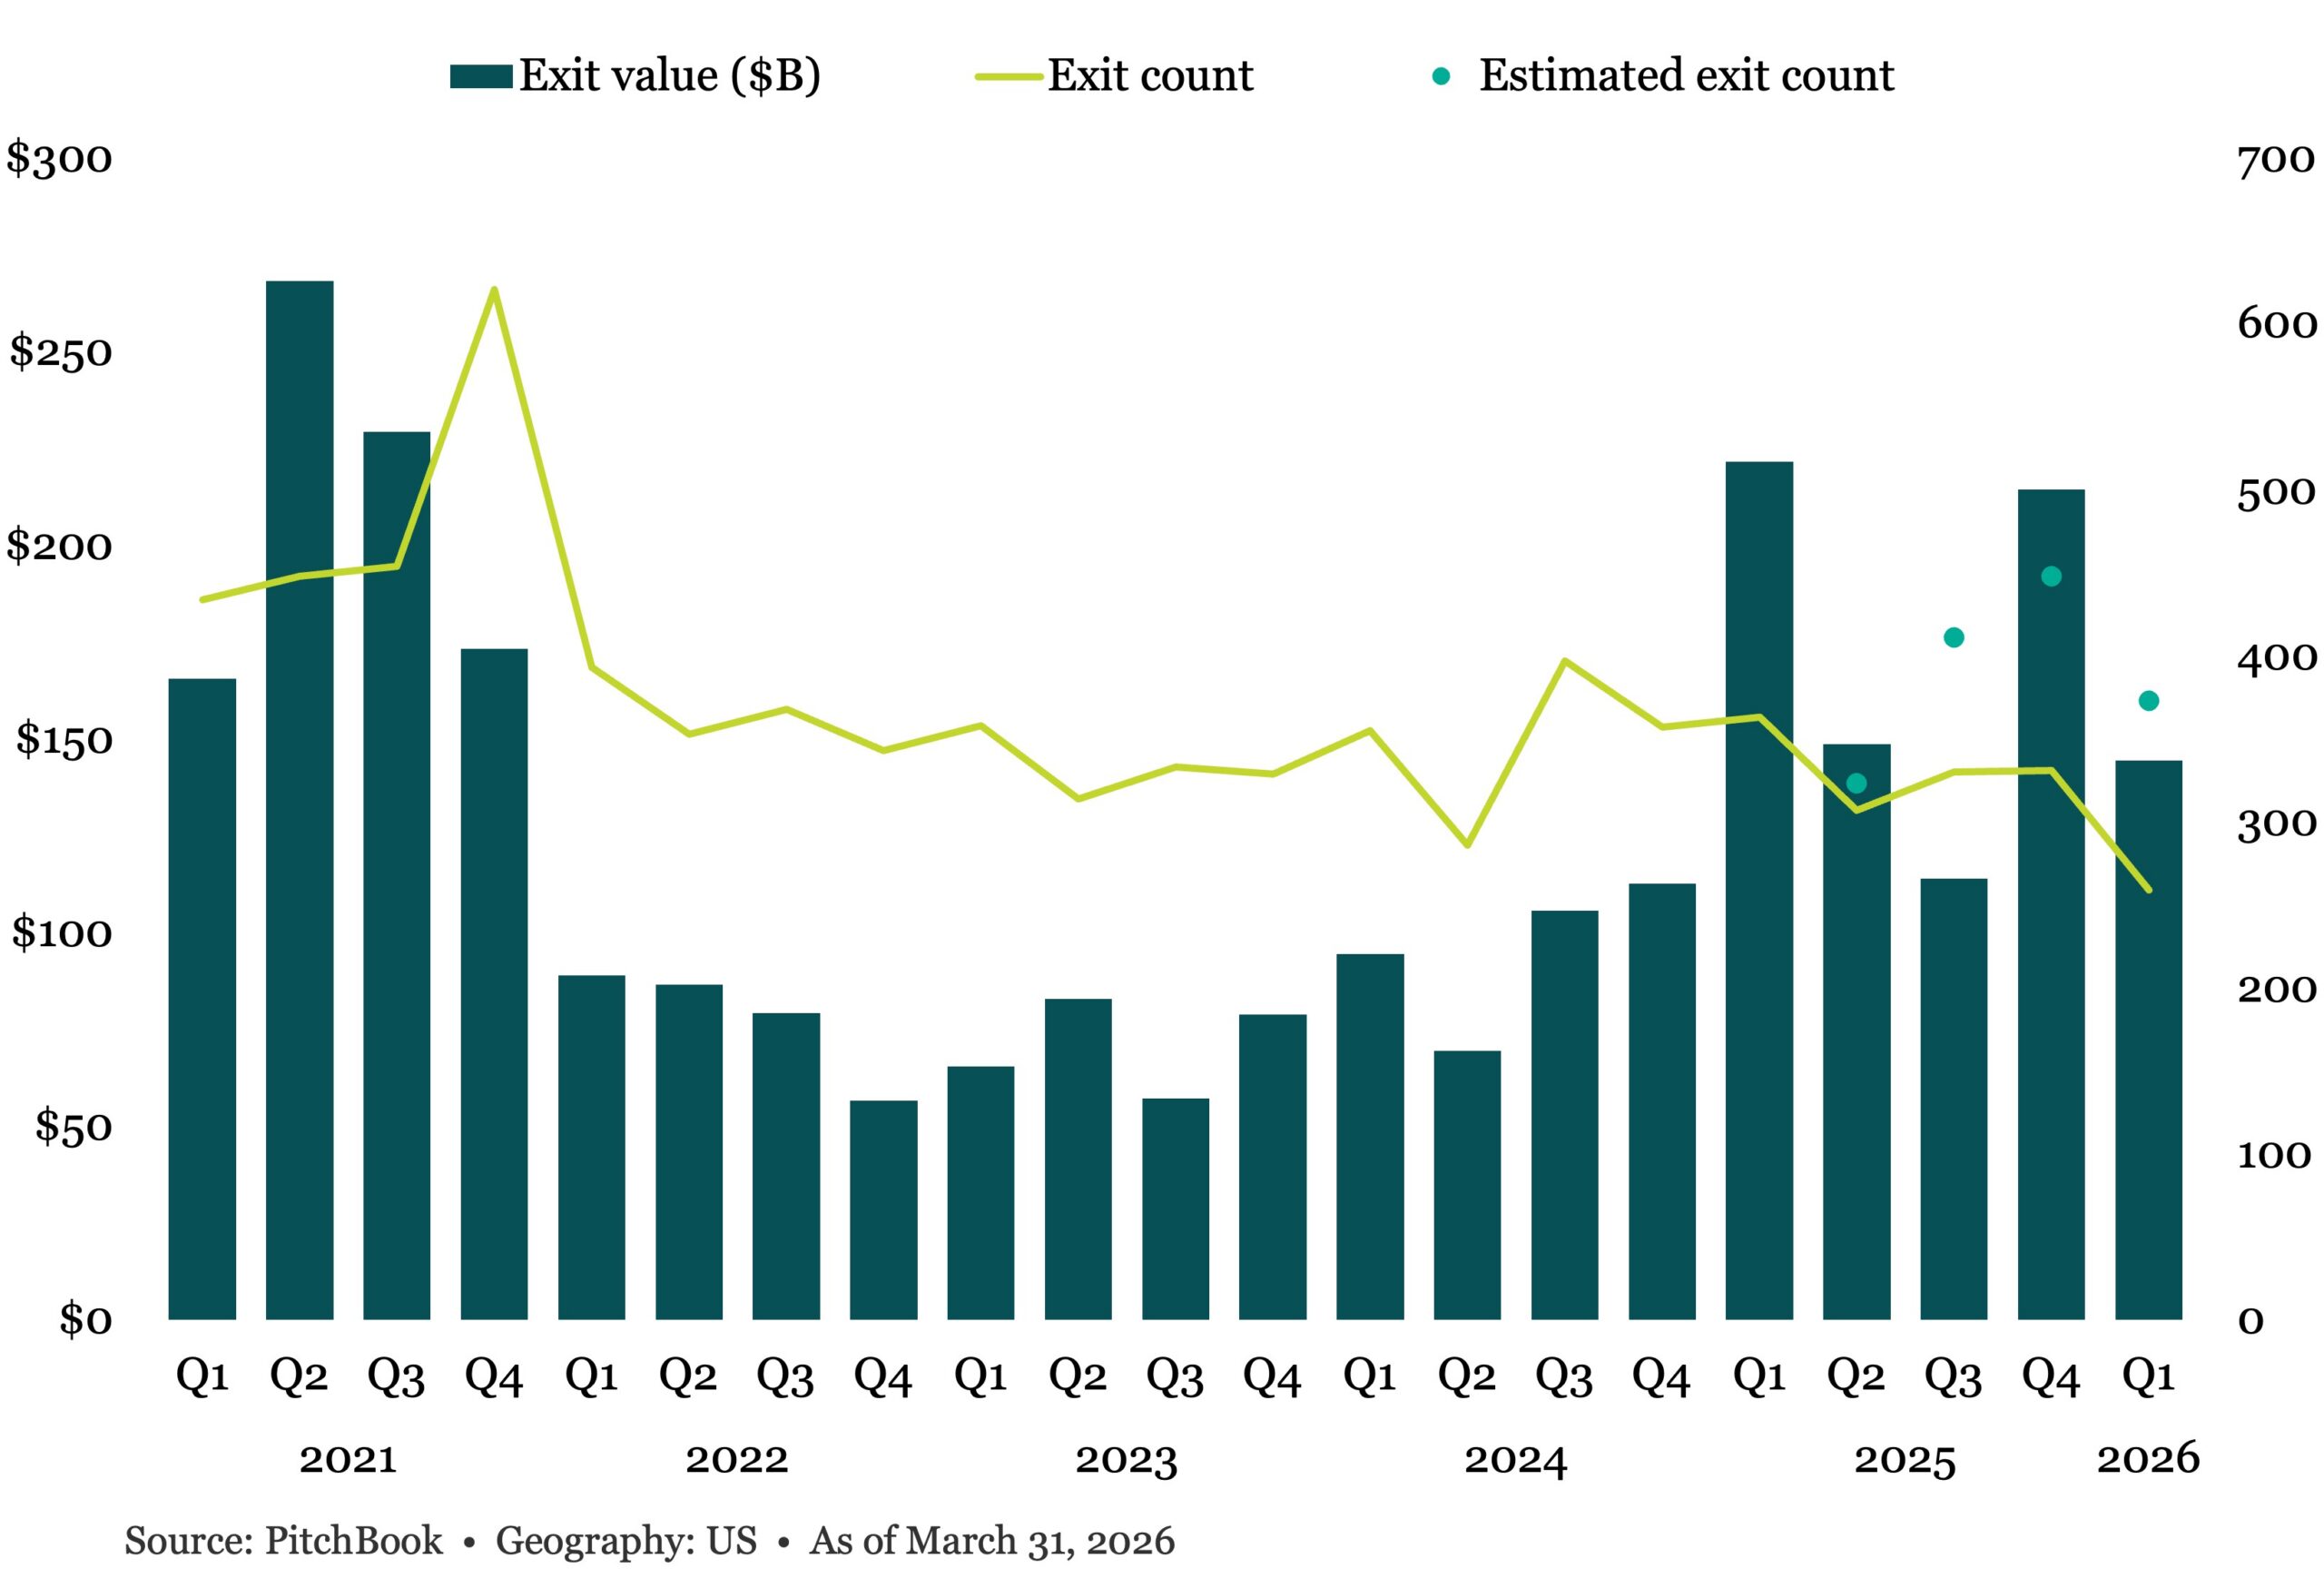
US PE exit activity pulled back in Q1 2026, as the many headwinds made it difficult to maintain the momentum seen in H2 2025. With an estimated 373 exits for an aggregate of $144.4 billion, exit activity declined 32.7% and 16.7% QoQ, respectively, with exit value down 34.8% YoY. The PE exit environment is experiencing a sort of déjà vu: a promising yearend that is derailed early in the new year by unexpected market changes. “Liberation Day” was the culprit in 2025, but 2026 is facing a hydra formed by the concerns we discussed earlier: AI disruption, the war in Iran, and reduced odds of rate cuts. Still, zooming out, exit activity in Q1 2026 remained resilient, as the magnitude of the QoQ decline owes more to Q4 2025’s outsized strength than another reset in the exit environment. Exit activity is comparable to that of Q2 2025, which bore the brunt of last year’s market turbulence, and Q1 2026 exit values stayed well above pre-pandemic averages and even exit count 7.3% above the proxy for historical “normal” levels of activity. We continue to monitor how exit value and even exit count move together, observing that the recent surge in exit activity was driven by a jump in larger transactions rather than a broader number of assets being sold. Q1 exit activity remained disproportionately driven by mega-sized exits, transactions of $1 billion or greater, despite the QoQ decline.
(Past performance is no guarantee of future results.)


Latest news

US leveraged loan launches reach five-month high in September
The US leveraged loan market recorded $93.6b of launches in September, marking the busiest month of primary market activity since…

Information technology topped nonaccruals on a cost basis
The information technology sector moved from second place in the first quarter to the top of the list in the second quarter
